
经过处理..。通过do.call()
我正在尝试为一个S3对象编写一个方法,该方法扩展xy.coords() (),该对象本质上是一个xy.coords()列表列表。我希望能够灵活地使用...,但我需要处理其中的参数以保持美观(即xaxt和yaxt参数)。下面是我编写的一个测试函数:
#test of ... expansion and modification
test = function(x, ...) {
  # x is a list of xy.coords() lists

  vargs = list(...)
  str(vargs)
  #vargs = as.list(substitute(list(...)))[-1L]
  # plotting defaults for aesthetics if they are not explicitly set
  if (!'xaxt' %in% names(vargs)) vargs[['xaxt']] = 'n'
  if (!'yaxt' %in% names(vargs)) vargs[['yaxt']] = 'n'
  if (!'pch' %in% names(vargs)) vargs[['pch']] = 16
  if (!'cex' %in% names(vargs)) vargs[['cex']] = 0.5
  print(vargs)

  pargs = c(list(x=x[[1]]$x, y=x[[1]]$y), vargs)
  str(pargs)

  do.call(plot, pargs) # this produces a crazy plot with a bunch of text

  plot(x=x[[1]], ...) # this produces the desired results

  invisible(NULL)
}
我发出的电话是:
test(Y, xaxt='n', yaxt='n', pch=16, cex=0.5)其中(为了简洁而截断):
> Y[[1]]
$x
  [1]  0.001111111  0.501388889  1.001388889  1.501388889  2.001388889  2.501388889  3.001388889  3.501388889  4.001388889

$y
[1] 0.132 0.123 0.126 0.143 0.145 0.123 0.128 0.131 0.140正如我在test()中的注释中所指出的,将...展开为一个参数列表,并通过do.call将该列表传递给plot创建了一个图解,文本散落在各处,如下所示:
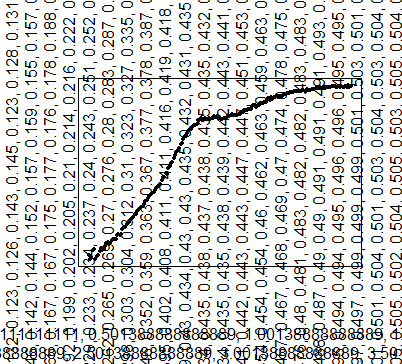
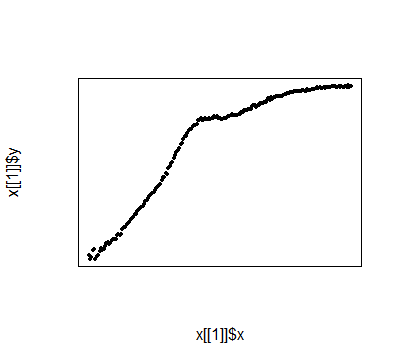
否则,直接将...传递给plot做我想做的事情:
我做错什么了吗,
- 我对
...的处理 - 我是如何把东西传给
do.call()的
我是完全遗漏了一个步骤/参数,还是这是R中的一个bug?下面的会议信息,并感谢您的帮助。
> sessionInfo()
R version 3.0.0 (2013-04-03)
Platform: x86_64-w64-mingw32/x64 (64-bit)

locale:
[1] LC_COLLATE=English_United States.1252  LC_CTYPE=English_United States.1252    LC_MONETARY=English_United States.1252
[4] LC_NUMERIC=C                           LC_TIME=English_United States.1252

attached base packages:
[1] stats     graphics  grDevices utils     datasets  methods   base

other attached packages:
[1] groan_1.0      roxygen2_2.2.2 digest_0.6.3

loaded via a namespace (and not attached):
[1] brew_1.0-6    stringr_0.6.2 tools_3.0.0
编辑
下面是我的问题的一个更兼容copy+paste的版本
#test of ... expansion and modification
test = function(x, method=c('do.call', 'dots'), ...) {
  # x is a list of xy.coords() lists

  vargs = list(...)
  str(vargs)
  #vargs = as.list(substitute(list(...)))[-1L]
  # plotting defaults for aesthetics if they are not explicitly set
  if (!'xaxt' %in% names(vargs)) vargs[['xaxt']] = 'n'
  if (!'yaxt' %in% names(vargs)) vargs[['yaxt']] = 'n'
  if (!'pch' %in% names(vargs)) vargs[['pch']] = 16
  if (!'cex' %in% names(vargs)) vargs[['cex']] = 0.5
  print(vargs)

  pargs = c(list(x=x[[1]]), vargs)
  str(pargs)

  method = match.arg(method)
  switch(method,
         do.call={
           do.call(plot, pargs) # this produces a crazy plot with a bunch of text
         }, dots={
           plot(x=x[[1]], ...) # this produces the desired results
         })

  invisible(NULL)
}

Y = list(xy.coords(runif(100), runif(100)))

# this produces a crazy plot with a bunch of text
test(Y, method='do.call', xaxt='n', yaxt='n', pch=16, cex=0.5)

# this produces the desired results
test(Y, method='dots', xaxt='n', yaxt='n', pch=16, cex=0.5)
分辨率
“影子”解决了我的问题。另一种选择是将ann=FALSE指定为传递给do.call()的列表中的一个参数。
回答 1
Stack Overflow用户
发布于 2013-08-01 06:30:27
问题是轴心标签。你实际上是在做类似的事情
小区(x=c(0.001111111、0.501388889、1.001388889、1.501388889、2.001388889、2.501388889、3.001388889、3.501388889、4.001388889、0.501388889、1.001388889、1.501388889、2.001388889、2.501388889、2.501388889、3.001388889、3.501388889、4.001388889、4.001388889、0.501388889、1.001388889、1.501388889、2.001388889、2.501388889、3.001388889、3.501388889、4.001388889))0.501388889、1.001388889、1.501388889、2.001388889、2.501388889、3.001388889、3.501388889、4.001388889、0.501388889、1.001388889、1.501388889、2.001388889、2.501388889、3.001388889、3.001388889、3.501388889、4.001388889、0.501388889、1.001388889、1.501388889、2.001388889、2.501388889、3.001388889、3.501388889、3.501388889、4.001388889、0.501388889、1.001388889、1.001388889( 1.501388889,2.001388889,2.501388889,3.001388889,3.501388889,4.001388889)
要解决这个问题,只需自己指定标签:
if (!'xlab' %in% names(vargs)) vargs[['xlab']] = names(x[[1]][2])
if (!'ylab' %in% names(vargs)) vargs[['ylab']] = names(x[[1]][1])https://stackoverflow.com/questions/17985474
复制相似问题
腾讯云开发者

Copyright © 2013 - 2026 Tencent Cloud. All Rights Reserved. 腾讯云 版权所有
深圳市腾讯计算机系统有限公司 ICP备案/许可证号:粤B2-20090059 ![]() 粤公网安备44030502008569号
粤公网安备44030502008569号
腾讯云计算(北京)有限责任公司 京ICP证150476号 | 京ICP备11018762号