
如何在多点模式下控制xticks
如何在多点模式下控制xticks
提问于 2013-07-22 05:39:48
正如标题所述,我想找到一种在multiplot模式下控制multiplot的方法。输出如下
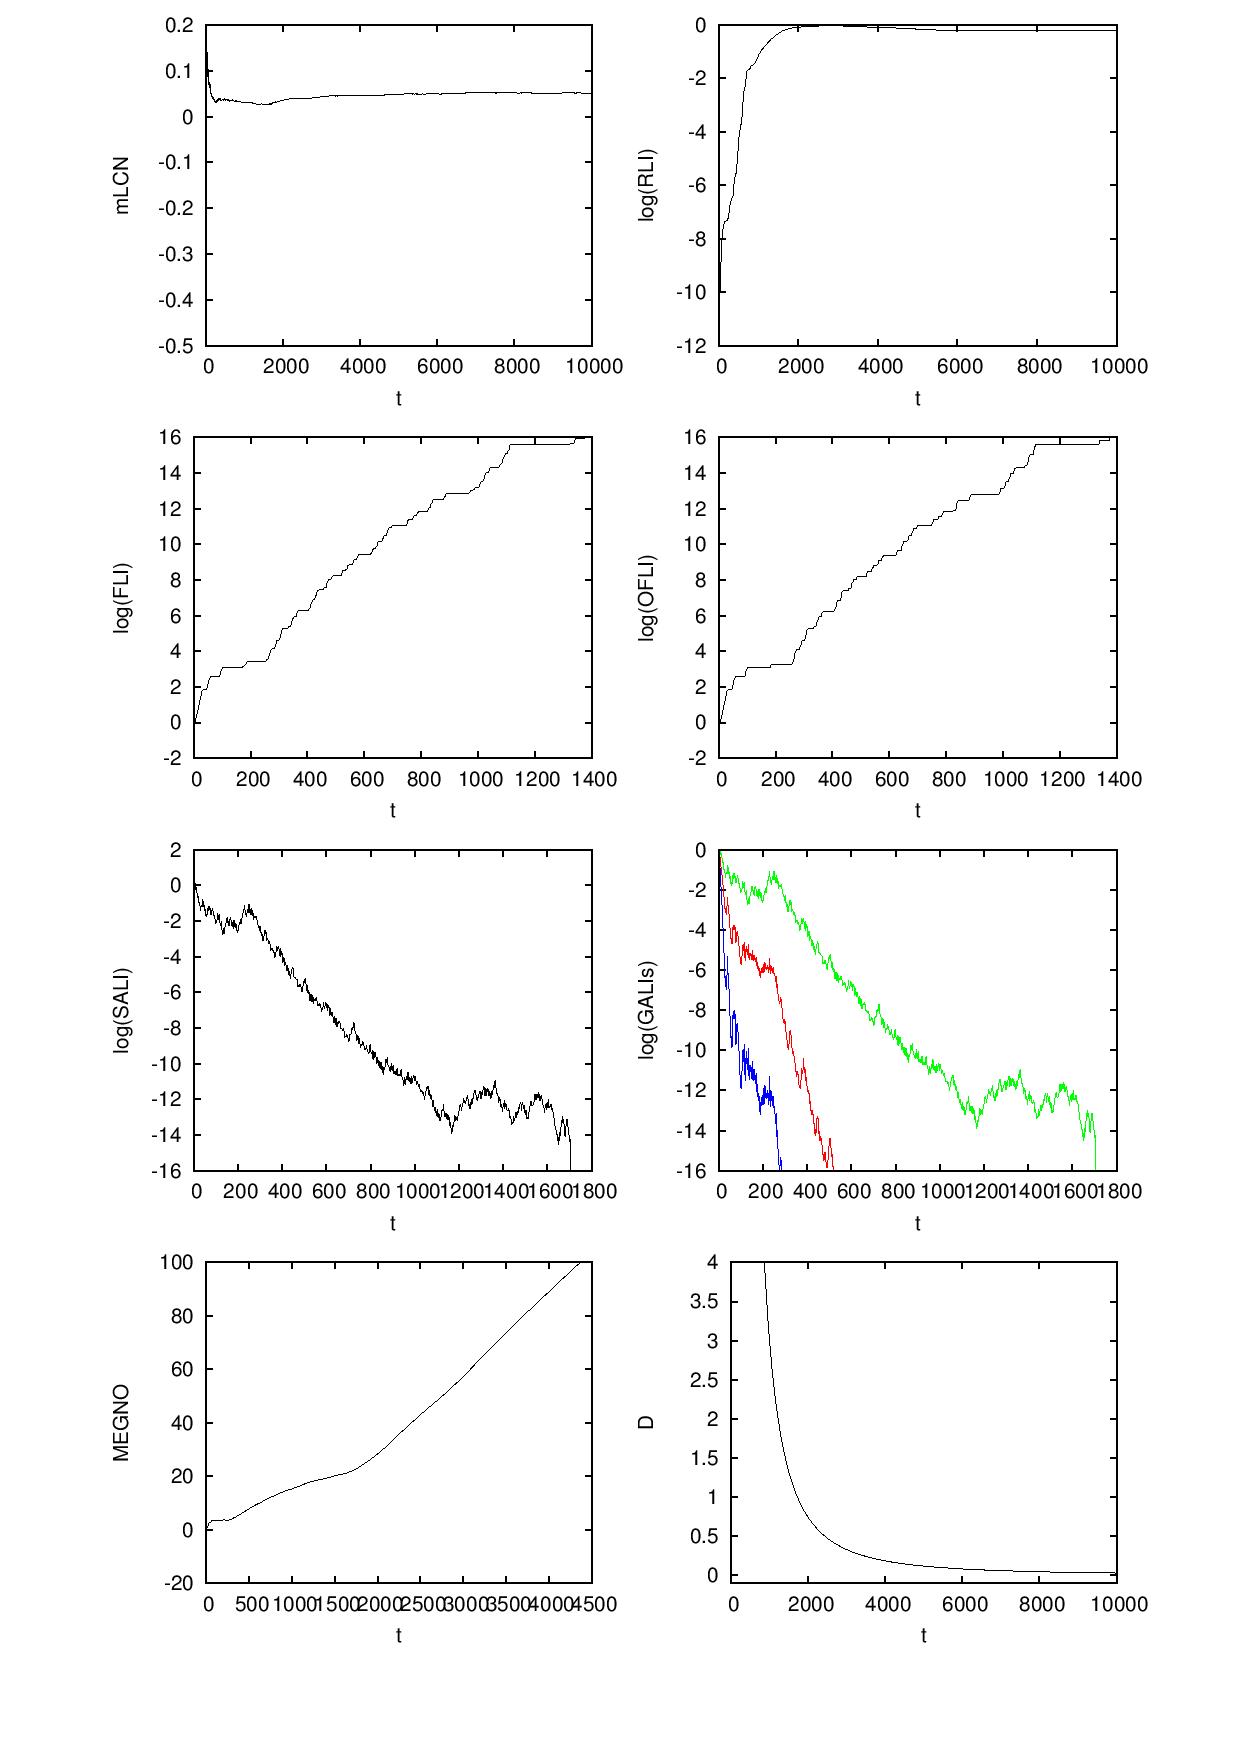
前两行所示的情节是可以的。然而,以下三个国家面临着同样的问题。X轴上的数字彼此非常接近,在某些情况下是重叠的。有办法解决这个问题吗?所有输入都是从外部数据文件中读取的,我无法事先知道t的最大值是什么,以便在每个绘图中进行set xrange [0:max],然后控制xtics。顺便问一下,在gnuplot中,是否可以在绘图阶段之前读取外部数据文件,并在每个地块中定义t的最大值?在此之前,非常感谢您。
编辑
用于生成上述输出的脚本如下:
reset

set term postscript eps enhanced "Helvetica" 20 size 7in, 11in
set output 'plots.eps'

set size 1,1

set multiplot layout 4, 2

unset key

# plotting the time-evolution of the mLCN
set xrange [*:*]
set xlabel 't'
set ylabel 'mLCN'
plot "hh.rli" u 1:3 w l lc rgb 'black'

# plotting the time-evolution of the RLI
set xrange [*:*]
set xlabel 't'
set ylabel 'log(RLI)'
plot "hh.rli" u 1:(log10($2)) w l lc rgb 'black'

# plotting the time-evolution of the FLI
set xrange [*:*]
set xlabel 't'
set ylabel 'log(FLI)'
plot "hh.fli" u 1:(log10($2)) w l lc rgb 'black'

# plotting the time-evolution of the OFLI
set xrange [*:*]
set xlabel 't'
set ylabel 'log(OFLI)'
plot "hh.fli" u 1:(log10($3)) w l lc rgb 'black'

# plotting the time-evolution of the SALI
set xrange [*:*]
set xlabel 't'
set ylabel 'log(SALI)'
plot "hh.sali" u 1:(log10($2)) w l lc rgb 'black'

# plotting the time-evolution of the GALIs
set xrange [*:*]
set xlabel 't'
set ylabel 'log(GALIs)'
plot "hh.gali" u 1:(log10($2)) w l lt 1 lc rgb 'green',\
     "hh.gali" u 1:(log10($3)) w l lt 1 lc rgb 'red',\
     "hh.gali" u 1:(log10($4)) w l lt 1 lc rgb 'blue'

# plotting the time-evolution of the MEGNO
set xrange [*:*]
set xlabel 't'
set ylabel 'MEGNO'
plot "hh.megno" u 1:2 w l lc rgb 'black'

# plotting the time-evolution of the Spectral Distance (D)
set xrange [*:*]
set yrange [-0.1:4]
set xlabel 't'
set ylabel 'D'
plot "hh.sd" u 1:2 w l lc rgb 'black'

unset multiplot

reset

set terminal windows

quit回答 2
Stack Overflow用户
发布于 2013-07-22 06:00:27
您可以告诉gnuGraph以下列方式旋转滴答标签:
set xtics rotate不过,这会占用更多的垂直空间。您可能会找到一个折中的解决方案,方法是选择一个小于90度的角度:
set xtics rotate by 45或者任何看起来最好的角度。
Stack Overflow用户
发布于 2014-10-18 09:49:22
你可以尝试增加个体抽搐之间的距离。例如,在左下角的图中,您可以每1000次显示一次,而不是每500次显示一次。这可以很容易地通过
set xtics 1000页面原文内容由Stack Overflow提供。腾讯云小微IT领域专用引擎提供翻译支持
原文链接:
https://stackoverflow.com/questions/17780626
复制相关文章
相似问题
腾讯云开发者

Copyright © 2013 - 2026 Tencent Cloud. All Rights Reserved. 腾讯云 版权所有
深圳市腾讯计算机系统有限公司 ICP备案/许可证号:粤B2-20090059 ![]() 粤公网安备44030502008569号
粤公网安备44030502008569号
腾讯云计算(北京)有限责任公司 京ICP证150476号 | 京ICP备11018762号