
如何在一个图形中显示多个图像?
如何在一个图形中显示多个图像?
提问于 2013-06-14 15:03:04
我使用Python matplotlib来绘制函数,并且我知道如何在不同的子图中绘制几个函数,就像这个图,
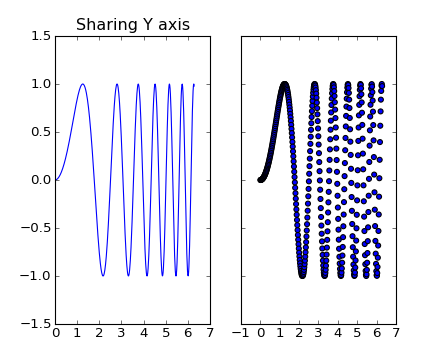
在处理图像时,我使用imshow()来绘制图像,但是如何用一个图形在不同的子图中绘制多个图像呢?
回答 2
Stack Overflow用户
发布于 2013-06-14 15:05:51
文档提供了一个示例(页面下降约四分之三):
import matplotlib.pyplot as plt
import matplotlib.image as mpimg
import numpy as np
fig = plt.figure()
a=fig.add_subplot(1,2,1)
img = mpimg.imread('../_static/stinkbug.png')
lum_img = img[:,:,0]
imgplot = plt.imshow(lum_img)
a.set_title('Before')
plt.colorbar(ticks=[0.1,0.3,0.5,0.7], orientation ='horizontal')
a=fig.add_subplot(1,2,2)
imgplot = plt.imshow(lum_img)
imgplot.set_clim(0.0,0.7)
a.set_title('After')
plt.colorbar(ticks=[0.1,0.3,0.5,0.7], orientation='horizontal')

# ---------------------------------------
# if needed inside the application logic, uncomment to show the images
# plt.show()基本上,这与您通常使用fig.add_subplot创建轴时一样.
Stack Overflow用户
发布于 2019-02-25 16:09:03
简单的python代码,可以在图形中绘制子图;
rows=2
cols=3
fig, axes = plt.subplots(rows,cols,figsize=(30,10))
plt.subplots_adjust(wspace=0.1,hspace=0.2)
features=['INDUS','RM', 'AGE', 'DIS','PTRATIO','MEDV']
plotnum=1
for idx in features:
    plt.subplot(rows,cols,plotnum)
    sns.distplot(data[idx])
    plotnum=plotnum+1
plt.savefig('subplots.png')通过下面的链接获取更详细的https://exploredatalab.com/how-to-plot-multiple-subplots-in-python-with-matplotlib/
页面原文内容由Stack Overflow提供。腾讯云小微IT领域专用引擎提供翻译支持
原文链接:
https://stackoverflow.com/questions/17111525
复制相关文章
相似问题
腾讯云开发者

Copyright © 2013 - 2026 Tencent Cloud. All Rights Reserved. 腾讯云 版权所有
深圳市腾讯计算机系统有限公司 ICP备案/许可证号:粤B2-20090059 ![]() 粤公网安备44030502008569号
粤公网安备44030502008569号
腾讯云计算(北京)有限责任公司 京ICP证150476号 | 京ICP备11018762号