
ggplot2 2/125个类别的彩色酿酒机定性棕榈
ggplot2 2/125个类别的彩色酿酒机定性棕榈
提问于 2013-02-08 15:22:43
我有以下数据:
- 10个州
- 每种状态有两种类型
- 每种类型都有1到29个实体。
- 每个状态实体类型都有一个计数。
完成数据作为要旨。
我试着想象每一个实体所占的比例。为此,我使用了以下代码:
icc <- transform( icc, state=factor(state), entity=factor(entity), type=factor(type) )
p <- ggplot( icc, aes( x=state, y=count, fill=entity ) ) +
  geom_bar( stat="identity", position="stack" ) +
  facet_grid( type ~ . )
custom_theme <- theme_update(legend.position="none")
p
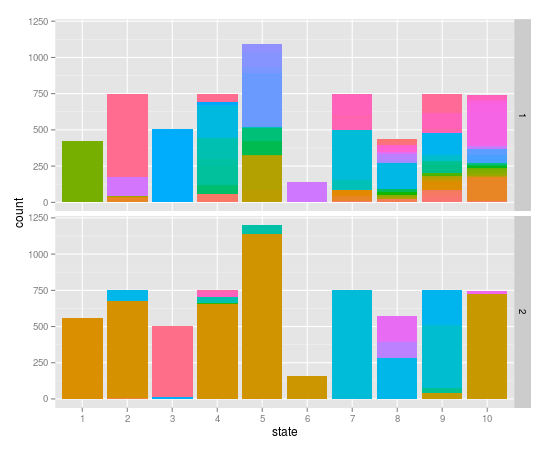
不幸的是,我失去了很多信息,因为有很多实体的状态类型没有显示足够的独特颜色。
如前所述,我有125个实体,但状态类型中的大多数实体是29个.有没有办法强迫ggplot2和彩色酿酒师在每种实体类型中分配唯一(希望相当不同的)颜色?
到目前为止,我想出的唯一方法是强迫entity生成一个整数,这个整数可以工作,但不能提供不同级别之间的颜色差异。
回答 1
Stack Overflow用户
回答已采纳
发布于 2013-02-08 20:02:59
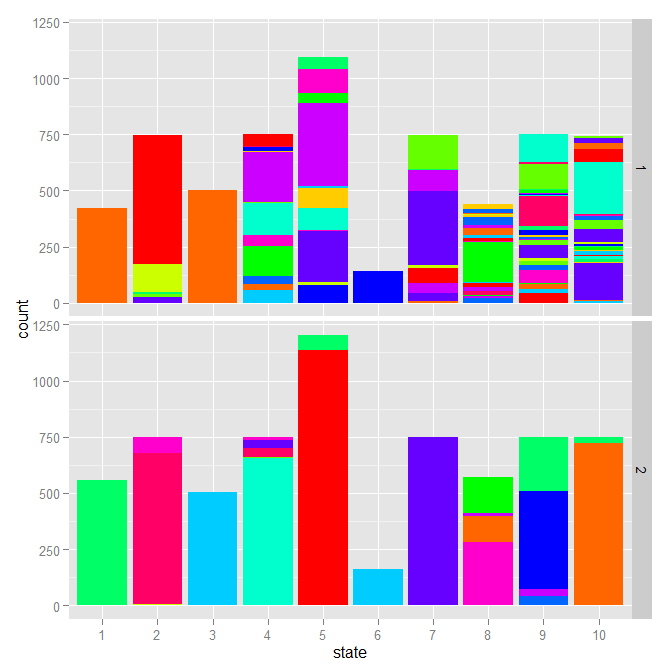
这里有一个方法可以给你提供更多的信息。以rainbow生成的颜色轮为例,对于其他颜色,将其与车轮上的另一个颜色交换。
col <- rainbow(30)
col.index <- ifelse(seq(col) %% 2,
                    seq(col),
                    (seq(ceiling(length(col)/2), length.out=length(col)) %% length(col)) + 1)
mixed <- col[col.index]

p <- ggplot(icc, aes(x=state, y=count, fill=entity)) +
  geom_bar(stat="identity", position="stack") +
  facet_grid( type ~ . ) +
  scale_fill_manual(values=rep(mixed, length.out=nrow(icc)))

custom_theme <- theme_update(legend.position='none')
p
页面原文内容由Stack Overflow提供。腾讯云小微IT领域专用引擎提供翻译支持
原文链接:
https://stackoverflow.com/questions/14775770
复制相关文章
相似问题
腾讯云开发者

Copyright © 2013 - 2026 Tencent Cloud. All Rights Reserved. 腾讯云 版权所有
深圳市腾讯计算机系统有限公司 ICP备案/许可证号:粤B2-20090059 ![]() 粤公网安备44030502008569号
粤公网安备44030502008569号
腾讯云计算(北京)有限责任公司 京ICP证150476号 | 京ICP备11018762号