
最大中间波动率
我有两个向量,a和b。见附件。
a是信号,是概率。b是下一个时期的绝对百分比变化。
Signalt <- seq(0, 1, 0.05)我想找到最大的绝对回报,出现在每个中间5%-瓷砖(Signalt)的向量。所以如果是
0.01, 0.02, 0.03, 0.06 0.07 然后,它应该计算出
     0.01 and 0.02,
     0.01 and 0.03,
     0.02 and 0.03.
然后转移到
0.06 and 0.07 do it over etc. 然后,当整个序列运行时,输出将合并到一个矩阵或表中。
它应该跟随向量a和b的索引。
i是一个索引,每当a跨入一个新的百分位数时,它都会被更新一次。t(i)是与ith交叉相关联的桶。
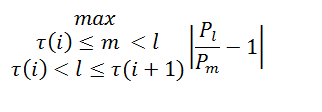
a是具有长度的概率向量。这个向量应该在其5%的瓷砖中进行分析,最大的中间绝对回报是输出。下一时期的价格变动是向量b。这将在下面的方程式中用P表示。l和m是索引。
每次信号从一个5%的瓷砖移动到另一个,我们计算最大的绝对回报发生在任何两个中间桶之间,直到信号移动到另一个5%的瓦片。例如,假设信号移动到第85百分位数,4个卷桶随后移动到第90百分位数。然后我们计算桶1和2,1和3,1和4,2和3,2和4,3,3和4之间的绝对回报。然后,我们将计算以下百分位数桶中的最大返回数,然后再转到下一个,这可能是第85个百分位数,依此类推。因此,我们让我是一个索引,每次信号从一个百分位数移动到另一个百分位数时,就会更新1,并且τ(i)是与ith交叉相关联的桶。
这是我所用的方程式。表示法可能略有不同。
现在我的问题是如何解决这个问题。也许有人对此有直观的解决办法。我希望我的问题很清楚。
"a","b"
0,0.013013698630137
0,0.0013522650439487
0,0.00135409614082593
0,0.00203389830508471
0.27804813511593,0.00135317997293627
0.300237801284318,0
0.495965075167796,0.00405405405405412
0.523741892051237,0.000672947510094168
0.558753750296458,0.00202020202020203
0.665762829019002,0.000672043010752743
0.493106479913899,0.000671591672263272
0.344592579573497,0.000672043010752854
0.336263897823707,0.00201748486886366
0.35884763774257,0.00536912751677865
0.23662807979007,0.00133511348464632
0.212636893966841,0.00267379679144386
0.362212830513403,0.000666666666666593
0.319216408413927,0.00333555703802535
0.277670854167344,0
0.310143323100971,0
0.374104373036218,0.00267737617135211
0.190943075221511,0.00268456375838921
0.165770070508112,0.00200803212851386
0.240310208616952,0.00133600534402145
0.212418038918236,0.00200133422281523
0.204282022136019,0.00200534759358306
0.363725074298064,0.000667111407605114
0.451807761954326,0.000666666666666593
0.369296011692801,0.000666222518321047
0.37503495989363,0.0026666666666666
0.323386355686901,0.00132978723404265
0.189216171830472,0.00266311584553924
0.185252052821193,0.00199203187250996
0.174882909380997,0.000662690523525522
0.149291525540782,0.00132625994694946
0.196824215268048,0.00264900662251666
0.164611993131396,0.000660501981505912
0.125470998266484,0.00132187706543285
0.179999532586703,0.00264026402640272
0.368749638521621,0.000658327847267826
0.427799340926225,0回答 2
Stack Overflow用户
发布于 2013-02-05 20:39:55
我对这个问题的解释
我希望我能正确理解你的问题。以下是我的理解:
- 对于每一行,计算它所属的5%百分位数。
- 每当这个百分位数发生变化时,您就启动一个新的桶。
- 同一桶中的所有行都会产生一个结果值。
- 如果桶中只有一行,则该行的
b值是结果值。 - 否则,您将计算所有
abs(b[l]/b[m]-1),其中m<l和两者都属于同一个桶
基本答案
代码
这里的代码完成了我前面描述的内容:
# read the data (shortened, full data in OP)
d <- read.table(textConnection("a,b
0,0.013013698630137
[…]
0.427799340926225,0
"), sep=",", header=TRUE)

# compute percentile number for each line
d$percentile <- floor(d$a/0.05)*5 + 5

# start a new bucket whenever the percentile changes
d$bucket <- cumsum(c(1, diff(d$percentile) != 0))

# compute a single number for all rows of the same bucket
aggregate(b ~ percentile + bucket, d, function(b) {
  if(length(b) == 1) return(b); # special case of only a single row
  m <- outer(b, b, function(pm, pl) abs(pl/pm - 1)) # compare all pairs
  return(max(m[upper.tri(m)])) # only return pairs with m < l
})
输出
结果如下:
   percentile bucket            b
1           5      1 0.8960891071
2          30      2 0.0013531800
3          35      3 0.0000000000
4          50      4 0.0040540541
5          55      5 0.0006729475
6          60      6 0.0020202020
7          70      7 0.0006720430
8          50      8 0.0006715917
9          35      9 2.0020174849
10         40     10 0.0053691275
11         25     11 1.0026737968
12         40     12 0.0006666667
13         35     13 0.0033355570
14         30     14 0.0000000000
15         35     15 0.0000000000
16         40     16 0.0026773762
17         20     17 0.2520080321
18         25     18 0.5010026738
19         40     19 0.0006671114
20         50     20 0.0006666667
21         40     21 3.0026666667
22         35     22 0.0013297872
23         20     23 0.7511597084
24         15     24 0.0013262599
25         20     25 0.7506605020
26         15     26 0.0013218771
27         20     27 0.0026402640
28         40     28 0.0006583278
29         45     29 0.0000000000
附加栏
代码
如果您还想知道每个组中的项目数,那么我建议您使用 library
library(plyr)

aggB <- function(b) {
  if(length(b) == 1) return(b)
  m <- outer(b, b, function(pm, pl) abs(pl/pm - 1))
  return(max(m[upper.tri(m)]))
}

ddply(d, .(bucket), summarise,
      percentile = percentile[1], n = length(b), maxr = aggB(b))
输出
这将给出以下结果:
   bucket percentile n         maxr
1       1          5 4 0.8960891071
2       2         30 1 0.0013531800
3       3         35 1 0.0000000000
4       4         50 1 0.0040540541
5       5         55 1 0.0006729475
6       6         60 1 0.0020202020
7       7         70 1 0.0006720430
8       8         50 1 0.0006715917
9       9         35 2 2.0020174849
10     10         40 1 0.0053691275
11     11         25 2 1.0026737968
12     12         40 1 0.0006666667
13     13         35 1 0.0033355570
14     14         30 1 0.0000000000
15     15         35 1 0.0000000000
16     16         40 1 0.0026773762
17     17         20 2 0.2520080321
18     18         25 3 0.5010026738
19     19         40 1 0.0006671114
20     20         50 1 0.0006666667
21     21         40 2 3.0026666667
22     22         35 1 0.0013297872
23     23         20 3 0.7511597084
24     24         15 1 0.0013262599
25     25         20 2 0.7506605020
26     26         15 1 0.0013218771
27     27         20 1 0.0026402640
28     28         40 1 0.0006583278
29 29 45 1 0.0000000000Stack Overflow用户
发布于 2013-02-05 19:58:18
我不确定是否能理解,但在这里是一次尝试。我的想法是按厘米对数据分组,而不是使用by对每个组进行计算。
- 要将数据分组,我要创建一个新的变量拆分 ##dat$split <- cut(dat$a,seq(0,1,0.05),include.lowest=T) dat$拆分<- c(0,累计(diff(dat$a)>include.lowest=T))
- 使用by,我可以在每个组中执行我的功能。我移除空prob值或一个值的单数情况。 通过(dat,dat$拆分,by=函数(X){P <- x$b,if( is.null(P)欧元/长度(P))返回(0) nn <- length(P) ind <- expand.grid(1:nn,1:nn) ## I在这里生成索引<- abs(P[ind,1]/P[ind,2]-1) ## perfom P_l/P_m-1 (向量化)列表(P=P,ret.max = max( ret ),ret.ind = indwhich.max(ret),})
这是结果列表。每隔一段时间,
- P( Prob值),
- 最大回报
- 计算此最大值的索引。
例如:
dat$split: 0
$P
[1] 0.0130 0.0014 0.0014 0.0020

$ret.max
[1] 8.6236

$ret.ind
  Var1 Var2
5    1    2

---------------------------------------------------------------------------------------------------------------
dat$split: 1
$P
[1] 0.0014 0.0000

$ret.max
[1] 1

$ret.ind
  Var1 Var2
2 2 1https://stackoverflow.com/questions/14711126
复制相似问题
腾讯云开发者

Copyright © 2013 - 2026 Tencent Cloud. All Rights Reserved. 腾讯云 版权所有
深圳市腾讯计算机系统有限公司 ICP备案/许可证号:粤B2-20090059 ![]() 粤公网安备44030502008569号
粤公网安备44030502008569号
腾讯云计算(北京)有限责任公司 京ICP证150476号 | 京ICP备11018762号