
r中的行标记群和“类型t”图
r中的行标记群和“类型t”图
提问于 2012-11-30 22:01:06
我从R.中的一个数据框架中生成了一个排序图,该数据框架包括按站点(行)排列的物种(列)。在矩阵中有一组经过“处理”的站点和一组控制站点。但是,我计算排序的方式不需要矩阵中的其他变量(即,没有明确的标识符说明站点是否“被处理”)。问题:我可以在不构造分类变量的情况下,逐组标记图中的点吗?或者,我是否可以给处理行(例如第1:7行)一种符号类型,而控件(例如8:14)另一种类型?
下面是一个例子:
#guess i don't have the reputation to post images...hmmm...

#looks something like this (first column is the site)

#     spec1 spec2 spec3...spec14
#  1    0     1     0  ...    2
#  2    1     5     0  ...    0
#  3    0     2     1  ...    0
#  .
#  .
#  .
#  14

# vegan package
library(vegan)

# example data matrix is 14x14, species names across columns, sites are numbered automatically upon import of txt file into RStudio

data(example)

#vegdist creates a distance matrix of sites

example.dis <- vegdist(example)

#monoMDS computes ordination of distance matrix

example.mds <- monoMDS(example.dis)

#plot it
这里我认为我可以修改这个图形,但我不知道如何实现它,
plot(example.mds) 回答 1
Stack Overflow用户
回答已采纳
发布于 2012-11-30 22:38:38
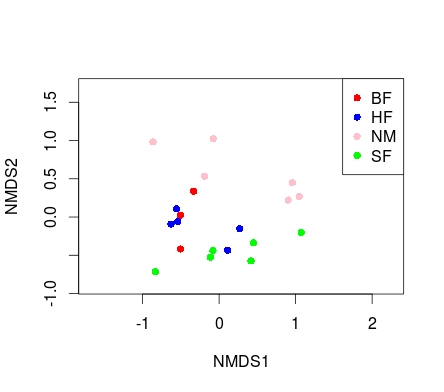
是的,您可以使用外部变量来指定点的颜色。
下面是一个示例:
# some data
require(vegan)
data(dune)
data(dune.env)

# vector holding the colors
cols <- c("red", "blue", "pink", "green")

# NMDS with bray-curtis distance
nmds <- metaMDS(dune, "bray", 2)

# empty plot
plot(nmds, type = "n")

# Add points colored by Environmental Variable Management
points(nmds, col = cols[dune.env$Management], pch = 16)

# add legend
legend("topright", legend=levels(dune.env$Management), col=cols, pch = 16)
页面原文内容由Stack Overflow提供。腾讯云小微IT领域专用引擎提供翻译支持
原文链接:
https://stackoverflow.com/questions/13653821
复制相关文章
相似问题
腾讯云开发者

Copyright © 2013 - 2026 Tencent Cloud. All Rights Reserved. 腾讯云 版权所有
深圳市腾讯计算机系统有限公司 ICP备案/许可证号:粤B2-20090059 ![]() 粤公网安备44030502008569号
粤公网安备44030502008569号
腾讯云计算(北京)有限责任公司 京ICP证150476号 | 京ICP备11018762号