
AndroidPlot和RectRegion行为
AndroidPlot和RectRegion行为
提问于 2012-11-01 14:30:00
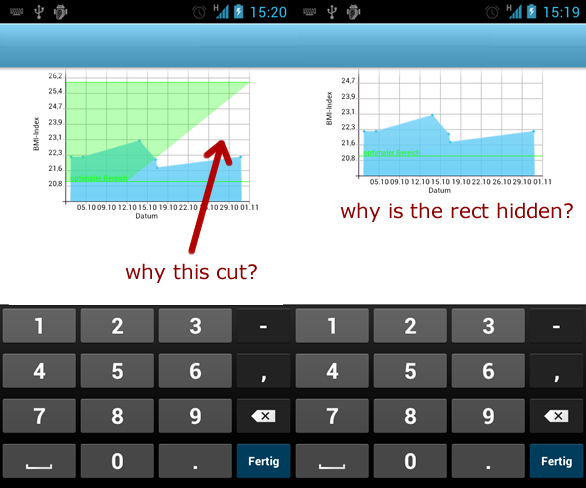
你好,我正在试着显示一个bmi图的正方根。
但是rect将被裁剪并隐藏在滚动事件中。
编辑:绿色区域应该是
点A(-infinity,21)点B(+无穷,21)点C(+无穷,26)点D(-infinity,26)
但B点为(12.10,21) //12.10为12-10-2012
    // optimal_range
    LineAndPointFormatter optFormat = new LineAndPointFormatter(Color.TRANSPARENT, Color.TRANSPARENT, Color.TRANSPARENT);
    XYRegionFormatter rf = new XYRegionFormatter(optimal_color_fill);
    RectRegion rr = new RectRegion(Double.NEGATIVE_INFINITY, Double.POSITIVE_INFINITY, optimal[0], optimal[1]);

    Number xDummy[] = { Double.NEGATIVE_INFINITY, Double.POSITIVE_INFINITY };
    Number yDummy[] = { optimal[1], optimal[1] };
    XYSeries optSerie = new SimpleXYSeries(Arrays.asList(xDummy), Arrays.asList(yDummy), "");
    mySimpleXYPlot.addSeries(optSerie, optFormat);
回答 1
Stack Overflow用户
回答已采纳
发布于 2012-11-01 15:05:01
我已经有一段时间没有看过这个代码了,我从来没有对区域做过任何事情,但是我认为如果你对数据进行平移和缩放,那么屏幕上的点就不会被画出来,这就会导致你看到的东西。为了使事情正确,需要剪辑线段,从屏幕到屏幕边缘。
页面原文内容由Stack Overflow提供。腾讯云小微IT领域专用引擎提供翻译支持
原文链接:
https://stackoverflow.com/questions/13179211
复制相关文章
相似问题
腾讯云开发者

Copyright © 2013 - 2026 Tencent Cloud. All Rights Reserved. 腾讯云 版权所有
深圳市腾讯计算机系统有限公司 ICP备案/许可证号:粤B2-20090059 ![]() 粤公网安备44030502008569号
粤公网安备44030502008569号
腾讯云计算(北京)有限责任公司 京ICP证150476号 | 京ICP备11018762号