
R:创建加拿大选定省份和美国各州的地图
我正试图创建一个选定的加拿大省/地区和选定的美国州的地图。到目前为止,最好的地图似乎是用GADM数据生成的地图:http://www.gadm.org/。
然而,我无法在同一张地图上绘制美国和加拿大的地图,也无法只绘制选定的省/地区和州。例如,我对阿拉斯加、育空、西北、不列颠哥伦比亚省、艾伯塔和蒙大拿等地感兴趣。
此外,美国地图似乎是沿着国际日期线划分的。
有谁能帮我:
dateline
- overlay
- 将上述省份/地区和州绘制在一张地图上
- ,避免美国沿着国际地理区域的一个纬度-经度网格
- 选择一个特定的投影,可能是多边形。
。
也许spplot不允许用户指定投影。我没有看到在see页面上选择投影的选项。我知道如何在地图包中选择带有映射函数的投影,但这些地图看起来不太好,我也无法绘制出具有该功能的省/地区和州的期望子集。
我不知道如何开始添加经纬度网格.但是,文件“sp.pdf”的3.2节似乎涉及到了这个主题。
下面是我到目前为止想出的代码。我已经加载了每一个地图相关的软件包,我偶然发现,并评论了GADM的数据,除了省/地区或州的边界。
不幸的是,到目前为止,我只绘制了加拿大或美国的地图。
library(maps)
library(mapproj)
library(mapdata)
library(rgeos)
library(maptools)
library(sp)
library(raster)
library(rgdal)

# can0<-getData('GADM', country="CAN", level=0) # Canada
  can1<-getData('GADM', country="CAN", level=1) # provinces
# can2<-getData('GADM', country="CAN", level=2) # counties

plot(can1)
spplot(can1, "NAME_1") # colors the provinces and provides
                       # a color-coded legend for them
can1$NAME_1            # returns names of provinces/territories
# us0 <- getData('GADM', country="USA", level=0)
  us1 <- getData('GADM', country="USA", level=1)
# us2 <- getData('GADM', country="USA", level=2)
plot(us1)              # state boundaries split at
                       # the dateline
us1$NAME_1             # returns names of the states + DC
spplot(us1, "ID_1")
spplot(us1, "NAME_1")  # color codes states and
                       # provides their names
#
# Here attempting unsuccessfully to combine U.S. and Canada on one map.
# Attempts at selecting given states or provinces have been unsuccessful.
#
plot(us1,can1)
us.can1 <- rbind(us1,can1)
谢谢你的帮助。到目前为止,我在上面的步骤2-4方面没有取得任何进展。也许我要求的太多了。也许我应该切换到ArcGIS并尝试一下这个软件。
我读过StackOverflow的这篇文章:
编辑
我现在借了一本电子拷贝的“应用空间数据分析与R‘Bevand等。(2008年)并从该书网站下载(或找到)相关的R代码和数据:
http://www.asdar-book.org/
我还在这里找到了一些好看的GIS相关的R代码:
https://sites.google.com/site/rodriguezsanchezf/news/usingrasagis
如果我学会了如何实现预期的目标,我将在这里发布解决方案。虽然如果我不能完成R中的目标,我可能最终会搬到ArcGIS。
回答 2
Stack Overflow用户
发布于 2012-05-27 22:11:08
要在同一设备上绘制多个SpatialPolygons对象,一种方法是首先指定要绘制的地理范围,然后使用plot(..., add=TRUE)。这只会增加地图上感兴趣的点。
使用投影(例如,多边形投影)进行绘图,首先需要在spTransform()包中使用rgdal函数,以确保所有层都在同一投影中。
## Specify a geographic extent for the map
## by defining the top-left and bottom-right geographic coordinates
mapExtent <- rbind(c(-156, 80), c(-68, 19))
## Specify the required projection using a proj4 string
## Use http://www.spatialreference.org/ to find the required string
## Polyconic for North America
newProj <- CRS("+proj=poly +lat_0=0 +lon_0=-100 +x_0=0
+y_0=0 +ellps=WGS84 +datum=WGS84 +units=m +no_defs")
## Project the map extent (first need to specify that it is longlat)
mapExtentPr <- spTransform(SpatialPoints(mapExtent,
proj4string=CRS("+proj=longlat")),
newProj)
## Project other layers
can1Pr <- spTransform(can1, newProj)
us1Pr <- spTransform(us1, newProj)
## Plot each projected layer, beginning with the projected extent
plot(mapExtentPr, pch=NA)
plot(can1Pr, border="white", col="lightgrey", add=TRUE)
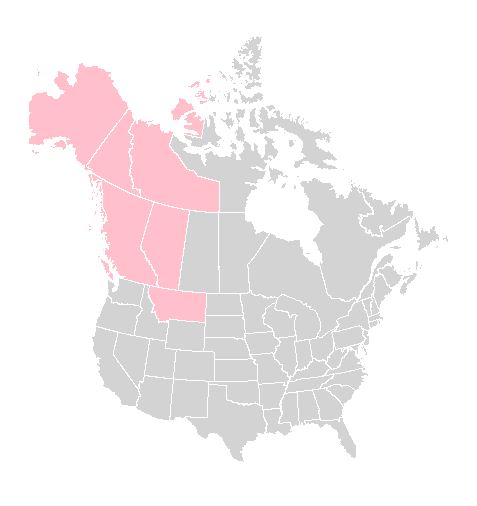
plot(us1Pr, border="white", col="lightgrey", add=TRUE)在地图中添加其他功能,例如突出感兴趣的法域,可以很容易地使用相同的方法:
## Highlight provinces and states of interest
theseJurisdictions <- c("British Columbia",
                        "Yukon",
                        "Northwest Territories",
                        "Alberta",
                        "Montana",
                        "Alaska")

plot(can1Pr[can1Pr$NAME_1 %in% theseJurisdictions, ], border="white",
    col="pink", add=TRUE)

plot(us1Pr[us1Pr$NAME_1 %in% theseJurisdictions, ], border="white",
    col="pink", add=TRUE)
结果如下:
我认为,在使用投影时添加网格行非常复杂,因此需要另一篇文章。看起来好像@马克米勒,因为它添加了下面!
Stack Overflow用户
发布于 2012-05-28 13:07:43
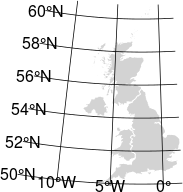
下面,我修改了PaulG的优秀答案,以显示经纬度网格。网格比我想的要粗,但可能足够了。我使用英国和下面的代码。我不知道如何在这篇文章中包含这个结果。
library(rgdal)
library(raster)

# define extent of map area
mapExtent <- rbind(c(0, 62), c(5, 45))

# BNG is British National Grid
newProj <- CRS("+proj=tmerc +lat_0=49 +lon_0=-2 +k=0.999601271625
           +x_0=400000 +y_0=-100000 +ellps=airy +units=m +no_defs")

mapExtentPr <- spTransform(SpatialPoints(mapExtent,
                  proj4string=CRS("+proj=longlat")),
                  newProj)

# provide a valid 3 letter ISO country code
# obtain a list with: getData("ISO3")
uk0 <- getData('GADM', country="GBR", level=0) # UK
uk1 <- getData('GADM', country="GBR", level=1) # UK countries
uk2 <- getData('GADM', country="GBR", level=2) # UK counties

# United Kingdom projection
uk1Pr      <- spTransform(uk1, newProj)

# latitude-longitude grid projection
grd.LL     <- gridlines(uk1, ndiscr=100)
lat.longPR <- spTransform(grd.LL, newProj)

# latitude-longitude text projection
grdtxt_LL  <- gridat(uk1)
grdtxtPR   <- spTransform(grdtxt_LL, newProj)

# plot the map, lat-long grid and grid labels
plot(mapExtentPr, pch=NA)
plot(uk1Pr, border="white", col="lightgrey", add=TRUE)
plot(lat.longPR, col="black", add=TRUE)
text(coordinates(grdtxtPR),
   labels=parse(text=as.character(grdtxtPR$labels)))
结果如下:
https://stackoverflow.com/questions/10763421
复制相似问题
腾讯云开发者

Copyright © 2013 - 2026 Tencent Cloud. All Rights Reserved. 腾讯云 版权所有
深圳市腾讯计算机系统有限公司 ICP备案/许可证号:粤B2-20090059 ![]() 粤公网安备44030502008569号
粤公网安备44030502008569号
腾讯云计算(北京)有限责任公司 京ICP证150476号 | 京ICP备11018762号