
矩阵库中一个因子对地块规模的影响
我正在用python创建一个情节。有办法用一个因子来调整轴的比例吗?yscale和xscale命令只允许我关闭日志规模。
编辑:
例如。如果我有一幅x标度从1nm到50 nm的曲线,x标度将从1x10^(-9)到50x10^(-9),我希望它从1变到50。因此,我希望绘图函数将放置在图上的x值除以10^(-9)。
回答 3
Stack Overflow用户
发布于 2012-04-16 14:04:12
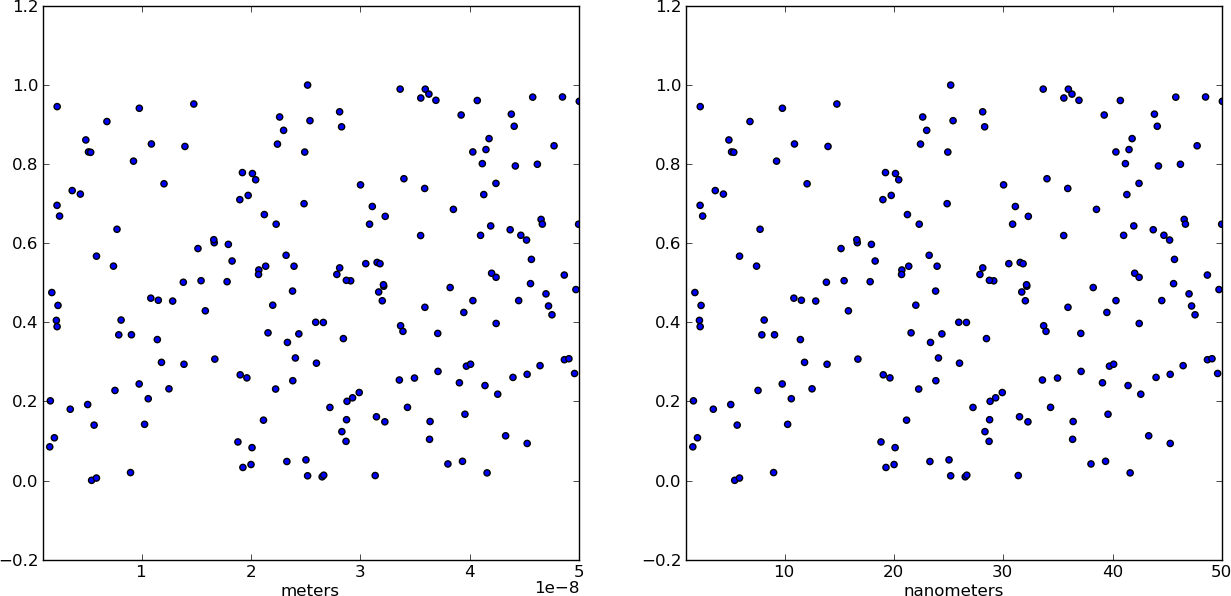
为什么不换个计量器呢?制作一个独立的x值数组X,其单位为nm.这样,当你绘制数据时,它已经是正确的格式了!只需确保添加了一个xlabel来指示单元(无论如何都应该这样做)。
from pylab import *

# Generate random test data in your range
N = 200
epsilon = 10**(-9.0)
X = epsilon*(50*random(N) + 1)
Y = random(N)

# X2 now has the "units" of nanometers by scaling X
X2 = (1/epsilon) * X

subplot(121)
scatter(X,Y)
xlim(epsilon,50*epsilon)
xlabel("meters")

subplot(122)
scatter(X2,Y)
xlim(1, 50)
xlabel("nanometers")

show()
Stack Overflow用户
发布于 2013-07-23 17:17:07
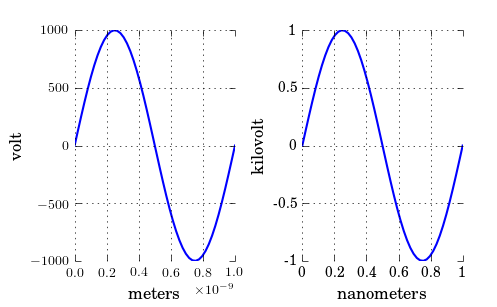
正如您注意到的,xscale和yscale不支持简单的线性重新调整(不幸的是)。作为钩子的答案的另一种选择,您可以这样欺骗标签,而不是扰乱数据:
ticks = ticker.FuncFormatter(lambda x, pos: '{0:g}'.format(x*scale))
ax.xaxis.set_major_formatter(ticks)
一个完整的例子展示了x和y的缩放:
import numpy as np
import pylab as plt
import matplotlib.ticker as ticker

# Generate data
x = np.linspace(0, 1e-9)
y = 1e3*np.sin(2*np.pi*x/1e-9) # one period, 1k amplitude

# setup figures
fig = plt.figure()
ax1 = fig.add_subplot(121)
ax2 = fig.add_subplot(122)
# plot two identical plots
ax1.plot(x, y)
ax2.plot(x, y)

# Change only ax2
scale_x = 1e-9
scale_y = 1e3
ticks_x = ticker.FuncFormatter(lambda x, pos: '{0:g}'.format(x/scale_x))
ax2.xaxis.set_major_formatter(ticks_x)

ticks_y = ticker.FuncFormatter(lambda x, pos: '{0:g}'.format(x/scale_y))
ax2.yaxis.set_major_formatter(ticks_y)

ax1.set_xlabel("meters")
ax1.set_ylabel('volt')
ax2.set_xlabel("nanometers")
ax2.set_ylabel('kilovolt')

plt.show()
最后,我得到了一张照片的学分:
注意,如果您和我一样有text.usetex: true,您可能希望将标签放在$中,如:'${0:g}$'。
Stack Overflow用户
发布于 2012-04-16 09:45:06
若要设置x轴的范围,可以使用set_xlim(left, right)、这是文件。
更新:
看起来你想要一个相同的情节,但只改变‘滴答值’,你可以通过得到滴答值,然后把它们更改成任何你想要的。为了满足你的需要,它会是这样的:
ticks = your_plot.get_xticks()*10**9
your_plot.set_xticklabels(ticks)https://stackoverflow.com/questions/10171618
复制相似问题
腾讯云开发者

Copyright © 2013 - 2026 Tencent Cloud. All Rights Reserved. 腾讯云 版权所有
深圳市腾讯计算机系统有限公司 ICP备案/许可证号:粤B2-20090059 ![]() 粤公网安备44030502008569号
粤公网安备44030502008569号
腾讯云计算(北京)有限责任公司 京ICP证150476号 | 京ICP备11018762号