
可以找到图像特性宽度的正确方法和Python包
输入是黑色背景上色彩斑斓(抱歉)垂直线的光谱。给定该波段的近似x坐标(标记为X),我想要找到该波段的宽度。
我不熟悉图像处理。请告诉我正确的图像处理方法和一个可以这样做的图像处理软件包。
我认为PIL,OpenCV给我的印象是,对于这个特定的应用程序来说太过分了。
如果我想让这个专家系统将来能够对进行分类,该怎么办?
回答 3
Stack Overflow用户
发布于 2012-03-19 13:59:28
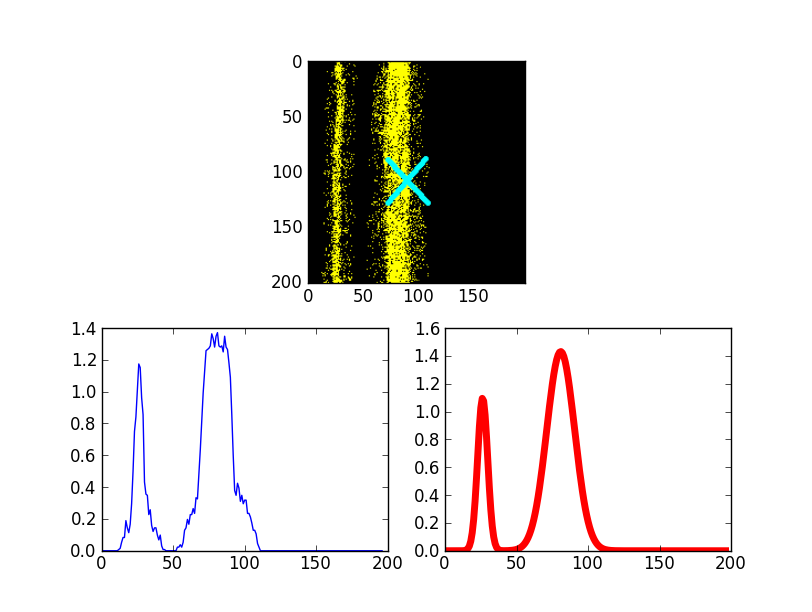
我将给出一个完整的最小工作示例(如sega_sai所建议的)。我不能访问你的原始图像,但你会发现这并不重要!以下代码发现的峰值分布如下:
平均值为: 26.2840960523 80.8255092125
import Image
from scipy import *
from scipy.optimize import leastsq

# Load the picture with PIL, process if needed
pic         = asarray(Image.open("band2.png"))

# Average the pixel values along vertical axis
pic_avg     = pic.mean(axis=2)
projection  = pic_avg.sum(axis=0)

# Set the min value to zero for a nice fit
projection /= projection.mean()
projection -= projection.min()

# Fit function, two gaussians, adjust as needed
def fitfunc(p,x):
    return p[0]*exp(-(x-p[1])**2/(2.0*p[2]**2)) + \
        p[3]*exp(-(x-p[4])**2/(2.0*p[5]**2))
errfunc = lambda p, x, y: fitfunc(p,x)-y

# Use scipy to fit, p0 is inital guess
p0 = array([0,20,1,0,75,10])
X  = xrange(len(projection))
p1, success = leastsq(errfunc, p0, args=(X,projection))
Y = fitfunc(p1,X)

# Output the result
print "Mean values at: ", p1[1], p1[4]

# Plot the result
from pylab import *
subplot(211)
imshow(pic)
subplot(223)
plot(projection)
subplot(224)
plot(X,Y,'r',lw=5)
show()
Stack Overflow用户
发布于 2012-03-19 13:12:19
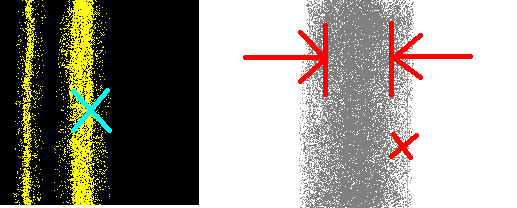
下面是一个简单的阈值方法来找出线和它们的宽度,它应该是相当可靠的工作对任何数目的线。下面的黄色和黑色图像是用这个脚本处理的,红色/黑色的图形用threshold = 0.3, min_line_width = 5的参数来说明找到的线条)

脚本对图像的行进行平均值,然后根据阈值(可以设置在0到1之间)和最小线宽(以像素为单位)确定每行的基本起始位置和结束位置。通过使用阈值和最小线宽,您可以很容易地过滤您的输入图像,以获得他们的线条。第一个函数find_lines以元组的形式返回图像中的所有行,其中包含每一行的开始、结束、中心和宽度。使用指定的find_closest_band_width调用第二个函数x_position,并返回与此位置最近的线的宽度(假设您希望每一行的距离为中心)。由于线路已经饱和(每个通道有255条断线),它们的横截面距离均匀分布不远,所以我不认为试图适应任何类型的分布确实会有太大帮助,只是不必要的复杂。
import Image, ImageStat

def find_lines(image_file, threshold, min_line_width):
    im = Image.open(image_file)
    width, height = im.size
    hist = []
    lines = []
    start = end = 0
    for x in xrange(width):
        column = im.crop((x, 0, x + 1, height))
        stat = ImageStat.Stat(column)
        ## normalises by 2 * 255 as in your example the colour is yellow
        ## if your images start using white lines change this to 3 * 255
        hist.append(sum(stat.sum) / (height * 2 * 255))

    for index, value in enumerate(hist):
        if value > threshold and end >= start:
            start = index
        if value < threshold and end < start:
            if index - start < min_line_width:
                start = 0
            else:
                end = index
                center = start + (end - start) / 2.0
                width = end - start
                lines.append((start, end, center, width))
    return lines

def find_closest_band_width(x_position, lines):
    distances = [((value[2] - x_position) ** 2) for value in lines]
    index = distances.index(min(distances))
    return lines[index][3]

## set your threshold, and min_line_width for finding lines
lines = find_lines("8IxWA_sample.png", 0.7, 4)
## sets x_position to 59th pixel
print 'width of nearest line:', find_closest_band_width(59, lines)Stack Overflow用户
发布于 2012-03-19 11:52:16
我不认为你需要任何花哨的东西来完成你的特定任务。
我只会用PIL + scipy。那应该就够了。
因为你基本上需要你的图像,做一个一维投影,然后拟合高斯或类似的东西到它。关于波段的大致位置的信息应该被使用,首先猜测适合的人。
https://stackoverflow.com/questions/9768232
复制相似问题
腾讯云开发者

Copyright © 2013 - 2026 Tencent Cloud. All Rights Reserved. 腾讯云 版权所有
深圳市腾讯计算机系统有限公司 ICP备案/许可证号:粤B2-20090059 ![]() 粤公网安备44030502008569号
粤公网安备44030502008569号
腾讯云计算(北京)有限责任公司 京ICP证150476号 | 京ICP备11018762号