
Python,networkx
我需要帮助,因为我不是编程专家。
对于具有n个节点和E边的给定图,我如何绘制平面图(如果它可以在平面上画成没有边交叉的平面图,则称为平面图)。然后翻转边,得到另一个平面图。(用于循环,直到我们得到所有的可能性)。
提前谢谢,我很感谢你的帮助。
PY
>>>#visualize with pygraphviz
    A=pgv.AGraph()
    File "<stdin>", line 6
    A=pgv.AGraph()
    ^
    SyntaxError: invalid syntax
>>> A.add_edges_from(G.edges())
    Traceback (most recent call last):
    File "<stdin>", line 1, in <module>
    NameError: name 'A' is not defined
>>> A.layout(prog='dot')
    Traceback (most recent call last):
    File "<stdin>", line 1, in <module>
    NameError: name 'A' is not defined
>>> A.draw('planar.png')
    Traceback (most recent call last):
    File "<stdin>", line 1, in <module>
NameError: name 'A' is not defined回答 1
Stack Overflow用户
发布于 2012-02-07 13:39:11
在你的问题中有几个很难计算的问题。
,首先,一些理论。如果图G是平面的,则G的每个子图都是平面的。从G(有e边)翻转边,将给出2^e-1平面图(如果我们不关心连通性),它是指数的(即巨大的和“坏的”)。很可能,你想要找到“最大”平面图。
如果你想画平面图,看上去也像平面图是计算困难,那是一回事,知道有一个图形表示边不交叉,另一件事是找到这样的表示。
到实现。似乎networkx没有检查图形是否是平面的函数。其他一些处理图形的包也有(例如,圣人具有g.is_planar()函数,其中g是一个图形对象)。下面,我写了一个“朴素”(必须有更有效的方法)平面性检查与networkx,基于Kuratowski定理。
import pygraphviz as pgv
import networkx as nx
import itertools as it
from networkx.algorithms import bipartite

def is_planar(G):
    """
    function checks if graph G has K(5) or K(3,3) as minors,
    returns True /False on planarity and nodes of "bad_minor"
    """
    result=True
    bad_minor=[]
    n=len(G.nodes())
    if n>5:
        for subnodes in it.combinations(G.nodes(),6):
            subG=G.subgraph(subnodes)
            if bipartite.is_bipartite(G):# check if the graph G has a subgraph K(3,3)
                X, Y = bipartite.sets(G)
                if len(X)==3:
                    result=False
                    bad_minor=subnodes
    if n>4 and result:
        for subnodes in it.combinations(G.nodes(),5):
            subG=G.subgraph(subnodes)
            if len(subG.edges())==10:# check if the graph G has a subgraph K(5)
                result=False
                bad_minor=subnodes
    return result,bad_minor

#create random planar graph with n nodes and p probability of growing
n=8
p=0.6
while True:
    G=nx.gnp_random_graph(n,p)
    if is_planar(G)[0]:
        break
#visualize with pygraphviz
A=pgv.AGraph()
A.add_edges_from(G.edges())
A.layout(prog='dot')
A.draw('planar.png')Edit2.如果您面临pygraphviz的问题,请尝试使用networkx绘制,也许您会发现结果正常。因此,与“使用pygraphviz可视化”块不同,请尝试以下步骤
import matplotlib.pyplot as plt
nx.draw(G)
# comment the line above and uncomment one of the 3 lines below (try each of them):
#nx.draw_random(G)
#nx.draw_circular(G)
#nx.draw_spectral(G)
plt.show()
of edit2.
结果是这样的。
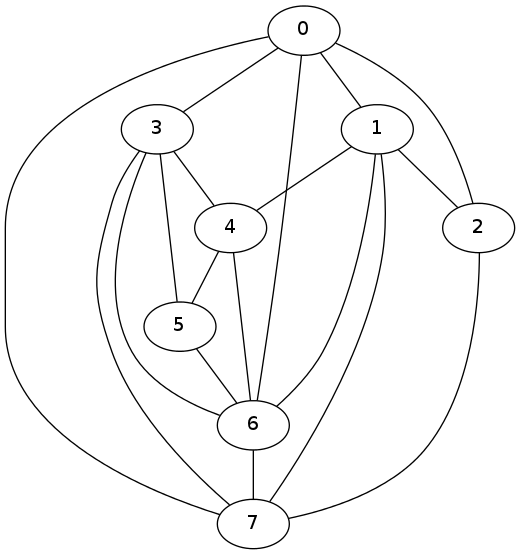
您可以看到图片上有一个交叉点(但图是平面的),它实际上是一个很好的结果(不要忘记问题在计算上是困难的),pygraphviz是使用启发式算法的墨维兹的包装器。在行A.layout(prog='dot')中,您可以尝试将“点”替换为“twopi”、“neato”、“circo”等,以查看您是否实现了更好的可视化。
编辑.让我们也考虑一下关于平面图的问题。让我们生成一个非平面图:
while True:
    J=nx.gnp_random_graph(n,p)
    if is_planar(J)[0]==False:
        break
我认为寻找平面子图最有效的方法是从“坏小图”(即K(5)或K(3,3))中剔除节点。以下是我的实现:
def find_planar_subgraph(G):
    if len(G)<3:
        return G
    else:
        is_planar_boolean,bad_minor=is_planar(G)
        if is_planar_boolean:
            return G
        else:
            G.remove_node(bad_minor[0])
            return find_planar_subgraph(G)
操作:
L=find_planar_subgraph(J)
is_planar(L)[0]
>> True
现在,您有了一个非平面图G的平面子图L(一个networkx图对象)。
https://stackoverflow.com/questions/9173490
复制相似问题
腾讯云开发者

Copyright © 2013 - 2026 Tencent Cloud. All Rights Reserved. 腾讯云 版权所有
深圳市腾讯计算机系统有限公司 ICP备案/许可证号:粤B2-20090059 ![]() 粤公网安备44030502008569号
粤公网安备44030502008569号
腾讯云计算(北京)有限责任公司 京ICP证150476号 | 京ICP备11018762号