
使用ggplot2的NP图
如何使用ggplot2生成NP图?
我做了一个简单的Rscript来生成条形图,点图。我通过csv文件提供数据。我需要指定多少列?在pass函数中,需要传递哪些参数?
我对R,ggplots很陌生。
编辑:这是NP图的意思。
当前代码尝试:
#load library ggplot2
library(ggplot2)

#get arguments
args <- commandArgs(TRUE)
pdfname <- args[1]
graphtype <- args[2]
datafile <- args[3]

#read csv file
tasks <- read.csv(datafile , header = T)
#name the pdf from passed arg 1
pdf(pdfname)

#main magic that generates the graph
qplot(x,y, data=tasks, geom = graphtype)
#clean up
dev.off()在.csv文件中有2列x,y我通过Rscript cne.R 11_16.pdf "point" "data.csv"调用这个脚本。
非常感谢,@mathematical.coffee,这是我需要的,但是
1>我正在从包含以下数据的csv文件中读取数据
这是我的数据月,按“一月”、"37.50“”二月“、"32.94”“三月”、"25.00“”4月“、"33.33”“五月”、"33.08“”六月“、"29.09”“七月”、"12.00“”8月“、"10.00”“9月”、"6.00“”10月“、"23.00”“11月”、"9.00“”12月“,"14.00“
2>我想在每个绘图点上显示值。同时显示UCL,Cl,LCL的值,并给出x和y的不同标签。
当我读取数据时,问题与csv文件中的顺序不同。怎么修呢?
回答 1
Stack Overflow用户
发布于 2012-01-23 05:42:07
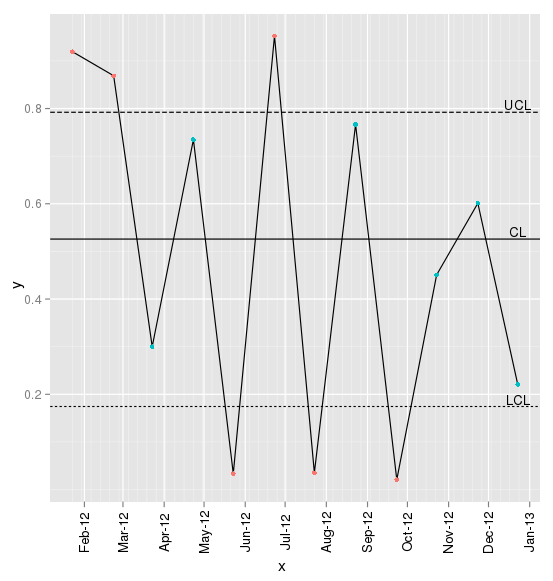
您可以将ggplot(tasks,aes(x=x,y=y))与geom_line和geom_point结合起来,以获得逐点连接的线路。
如果您还想要绘制UCL/LCL/etc,则添加一个geom_hline (水平线)。要向这些行添加文本,可以使用geom_text。
举个例子:
library(ggplot2)

# generate some data to use, say monthly up to a year from today.
n <- 12
tasks <- data.frame(
    x = seq(Sys.Date(),by="month",length=n),
    y = runif(n) )
CL  = median(tasks$y)       # substitue however you calculate CL here
LCL = quantile(tasks$y,.25) # substitue however you calculate LCL here
UCL = quantile(tasks$y,.75) # substitue however you calculate UCL here
limits = c(UCL,CL,LCL)
lbls   = c('UCL','CL','LCL')

p <- ggplot(tasks,aes(x=x,y=y)) +            # store x/y values
     geom_line() +                           # add line
     geom_point(aes(colour=(y>LCL&y<UCL))) + # add points, colour if outside limits
     opts(legend.position='none',            # remove legend for colours
          axis.text.x=theme_text(angle=90))  # rotate x axis labels

# Now add in the limits.
# horizontal lines + dashed for upper/lower and solid for the CL
p <- p + geom_hline(aes(yintercept=limits,linetype=lbls)) +            # draw lines
    geom_text(aes(y=limits,x=tasks$x[n],label=lbls,vjust=-0.2,cex=.8)) # draw text

# display
print(p)
这意味着:
https://stackoverflow.com/questions/8966316
复制相似问题
腾讯云开发者

Copyright © 2013 - 2026 Tencent Cloud. All Rights Reserved. 腾讯云 版权所有
深圳市腾讯计算机系统有限公司 ICP备案/许可证号:粤B2-20090059 ![]() 粤公网安备44030502008569号
粤公网安备44030502008569号
腾讯云计算(北京)有限责任公司 京ICP证150476号 | 京ICP备11018762号