
如何使用grImport导入的图形作为ggplot2中的轴勾标签(使用网格函数)?
我希望我能将grImport强大的导入和绘图功能与ggplot2强大的绘图功能结合起来,但我只是不太了解grid系统,无法找到一种优雅的方法来实现我想要的结果。我想要的是用使用ggplot2导入的图像替换grImport图形中的x轴勾标。
由于两个包都使用grid函数,我希望有一种方法可以在ggplot2框架内使用grid.symbols(),这将是理想的,或者至少在设备中的现有情节中是这样的。对这类事情有更多了解的人是否知道有一种强有力的方法可以做到这一点?或者,有人能告诉我更多的信息来帮助我了解grobs,视图等等吗?我已经阅读了关于网格图形模型的保罗·穆雷尔R图画书的自由章节,但是我还不太熟悉ggplot2的内部工作原理来建立链接。
我的问题非常类似于关于使用图像作为绘图点的一个现有问题,尽管我更感兴趣的是轴标签而不是绘图点。然而,我很想知道这两项任务有多相似,以及是否可以为此目的对这一解决办法进行调整。我自己想不出来的。
这是我的第一篇文章,所以我不允许发布图片,但是这段代码实现了一些接近我想要的东西。注意:这种方法使用的是一个丑陋的、不可移植的、不具有讽刺性的黑客。我想要生成的最后一幅图将有面(facet_grid),而x轴是针对在每个轴上有不同图片的因子,而不是一个连续变量,这就是为什么我正在寻找一个更通用/更健壮的解决方案,它不需要太多的尝试和错误。
library(ggplot2)
## library(grImport)  # not needed for this example, but would be for grid.symbols()

p <- ggplot(mtcars, aes(cyl, mpg)) + stat_summary(fun.data = "mean_cl_boot")
print(p)

## Replace (in this case, overlay) x-axis tick labels with a graphic / grob
iconSize  <- 0.05
iconHt    <- 0.2
padding   <- 0.09    # horizontal padding around axis: I found this by trial & error
tickSp    <- (1-padding)/(4*2)
downViewport("axis_h-5-3")
## I would use grid.symbols() with an imported Picture in place of grid.circle(),
## but the idea is the same: draw a shape at the ticks along the axis.
for (i in 0:(max(mtcars$cyl) - min(mtcars$cyl)) )
{
  grid.circle(x = (padding/2 + tickSp*(i*2)), y = iconHt,
              r = iconSize*(min(mtcars$cyl)+i), gp = gpar(fill="black"))
}

upViewport()回答 3
Stack Overflow用户
发布于 2012-01-19 07:30:28
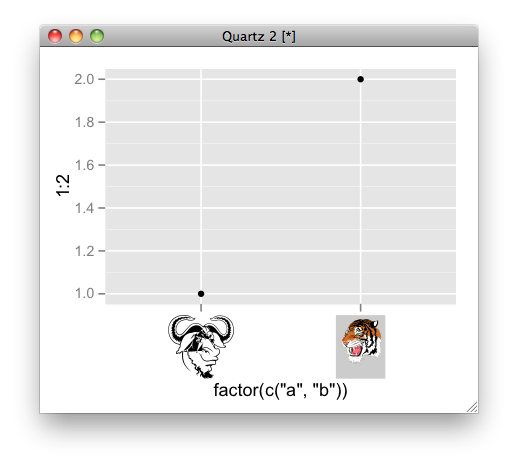
以下是一个例子:
# convert ps to RGML
PostScriptTrace(file.path(system.file(package = "grImport"), "doc", "GNU.ps"), "GNU.xml")
PostScriptTrace(file.path(system.file(package = "grImport"), "doc", "tiger.ps"), "tiger.xml")
# read xml
pics <- list(a = readPicture("GNU.xml"), b = readPicture("tiger.xml"))

# custom function for x axis label.
my_axis <- function () {
  structure(
      function(label, x = 0.5, y = 0.5, ...) {
         absoluteGrob(
           do.call("gList", mapply(symbolsGrob, pics[label], x, y, SIMPLIFY = FALSE)),
           height = unit(1.5, "cm"))
    }
)}

qplot(factor(c("a", "b")), 1:2) + opts( axis.text.x = my_axis())
Stack Overflow用户
发布于 2012-01-18 06:47:58
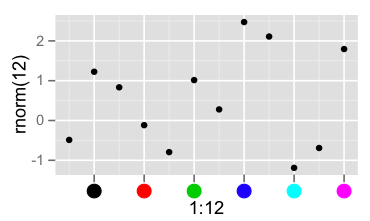
对于单个面板,从x轴grob提取信息并将其替换为您自己的面板是非常直接的。我不知道如何才能把它干净地扩展到自动的、多面板的轴上。
library(grid)
library(ggplot2)

p <- qplot(1:12, rnorm(12))
grid.newpage()
g <- ggplotGrob(p)
grid.draw(g)
g0 <- getGrob(g, gPath("axis.text.x"), grep=TRUE)
grid.set(gPath("axis.text.x"),
         pointsGrob(x = g0$x, y=0*g0$x + unit(0.5,"npc"),
                    pch=19, gp=gpar(col=seq_along(g0$x)),
                    name = g0$name), grep = TRUE)
Stack Overflow用户
发布于 2012-01-18 07:03:00
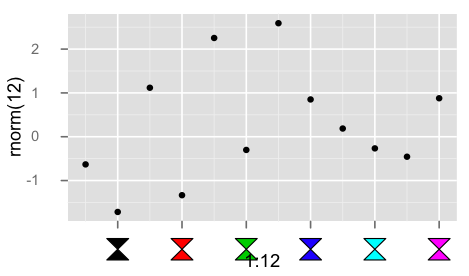
下面是对轴标签使用自定义grob的一个黑客。
library(grid)
library(ggplot2)

## convert the labels to some parameter to be used in the custom grob
## here simply an index that will be interpreted as color
mapping <- function(x, ...){
  seq_along(x)
}

library(grImport)

hourglass <- new("Picture",
paths= list(new("PictureFill",
x=c(0, 1, 0, 1),
y=c(0, 0, 1, 1))),
summary= new("PictureSummary",
numPaths=1,
xscale=c(0, 1),
yscale=c(0, 1)))

## bare bones edit of theme_text()
my_axis <- function ()
{
    structure(function(label, x = 0.5, y = 0.5, default.units = "npc", ...) {
      cols <- mapping(label)

      symbolsGrob(hourglass, x, 0*x + unit(0.5, "npc"),
                  use.gc=FALSE,size=unit(5,"mm"), gp=gpar(fill=cols))

    }, class = "theme", type = "custom", call = match.call())
}

qplot(1:12, rnorm(12)) +
  opts( axis.text.x = my_axis(), axis.ticks.margin = unit(0.5, "cm"))
https://stackoverflow.com/questions/8905101
复制相似问题
腾讯云开发者

Copyright © 2013 - 2026 Tencent Cloud. All Rights Reserved. 腾讯云 版权所有
深圳市腾讯计算机系统有限公司 ICP备案/许可证号:粤B2-20090059 ![]() 粤公网安备44030502008569号
粤公网安备44030502008569号
腾讯云计算(北京)有限责任公司 京ICP证150476号 | 京ICP备11018762号