
包含"sparkTable“包的多个系列的情节
如果我正确理解它,sparkTable包允许多种类型的绘图,但只能在一个系列上。因此,例如,如果我的dataset df如下所示:
可变值时间Level_1 34 1947 Level_1 38 1948 Level_1 17 1949 Level_1 61 1950 Level_1 19 1951 Level_1 80 1952 Level_1 57 1953 Level_1 66 1954
例如,变量"value“随”时间“在”变量“级别上发生变化,然后我就可以使用以下代码为不同级别的”变量“绘制”值“的火花线和条形图:
library(sparkTable)
content<-list()
content[['LinePlot']]<-newSparkLine()
content[['BarPlot']]<-newSparkBar()

varType<-rep("value",2)
df<-df[,c("variable","value","time")]
df$time<-as.numeric(as.character(df$time))
dat<-reshapeExt(df,idvar="variable",varying=list(2))
sparkTab<-newSparkTable(dat,content,varType)
plotSparkTable ( sparkTab , outputType = "html", filename = "t1")但是,在同一输出中是否有任何方法可以绘制多个系列?例如,假设我希望有一个“值”,另一个用于“值”系列的累积时间(由Cumulative_Value = ave(df$value, df$variable, FUN=cumsum)计算)
回答 1
Stack Overflow用户
发布于 2011-12-22 01:46:59
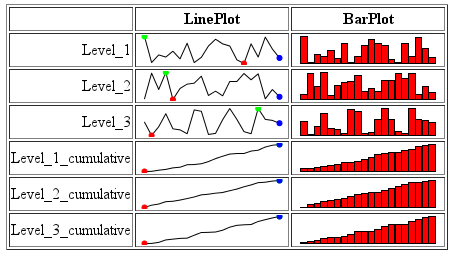
您的意思是向结果的sparkTable添加额外的行吗?
编辑:OP需要添加额外的列,而不是行。
增加额外的列
要添加额外的列,只需更新df、content和varType以包含累积值。在代码中添加以下内容:
# with the other lines defining content:
content[['Cumulative']] <- newSparkLine()

# add the following to your df
df$cumulative = ave(df$value, df$variable, FUN=cumsum)

# add the following to your varType definition
varType <- c('value','value','cumulative')
剩下的可以保持不变。
第一行向表中添加另一条火花线列,第二行计算cumulative列并将其添加到数据框架中,第三行告诉newSparkTable前两幅图分别用于value列和cumulative列。
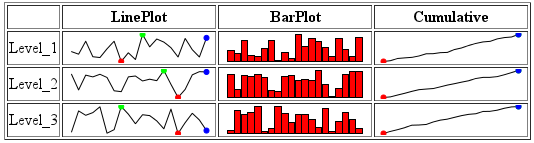
增加额外的行
我知道的唯一方法(也不是很好)是向您的df中添加额外的行,每个行对应于累积值。
例如:
# make dummy data table with Levels 1 2 3,
#  years 1947:1966 for each, and
#  values being random from 1 to 100.
years <- 1947:1966
n     <- length(years)
df    <- data.frame( variable=sprintf('Level_%i',rep(1:3,each=n)), value=sample(100,3*n,replace=T), time=years )

# as before (setting up spark table)
library(sparkTable)
content<-list()
content[['LinePlot']]<-newSparkLine()
content[['BarPlot']]<-newSparkBar()

# ** calculate cumulative value, and APPEND to the dataframe
# There is a different cumulative line for *each* level.
# Hence we need to make new factors
#  Level_1_cumulative, Level_2_cumulative, Level_3_cumulative
cv  <- ave(df$value, df$variable, FUN=cumsum)
df2 <- rbind(df, data.frame( variable=sprintf('Level_%i_cumulative',rep(1:3,each=n)), value=cv, time=years ))

# as before (make sparktable, but use df2 this time)
dat<-reshapeExt(df2,idvar="variable",varying=list(2))
varType<-rep("value",2)
sparkTab<-newSparkTable(dat,content,varType)
plotSparkTable ( sparkTab , outputType = "html", filename = "t1")
最后我得到了这样的结果:
https://stackoverflow.com/questions/8588060
复制相似问题
腾讯云开发者

Copyright © 2013 - 2026 Tencent Cloud. All Rights Reserved. 腾讯云 版权所有
深圳市腾讯计算机系统有限公司 ICP备案/许可证号:粤B2-20090059 ![]() 粤公网安备44030502008569号
粤公网安备44030502008569号
腾讯云计算(北京)有限责任公司 京ICP证150476号 | 京ICP备11018762号