
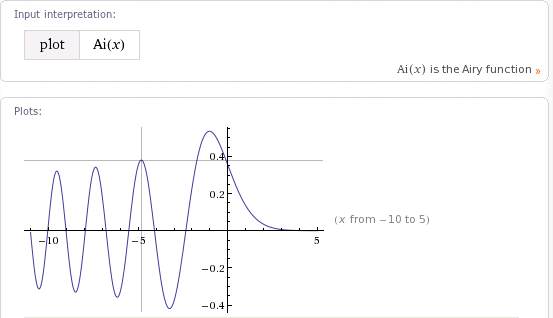
如何在Mathematica中获得Wolfram\Alpha 2D图形的交叉行为?
如何在Mathematica中获得Wolfram\Alpha 2D图形的交叉行为?
提问于 2011-11-22 06:12:44
回答 4
Stack Overflow用户
回答已采纳
发布于 2011-11-22 15:51:29
下面是另一种使用Nearest的方法,这与Simon的方法有些不同:
plot = Plot[{Sin[x], Cos[x]}, {x, -2 Pi, 2 Pi}];
With[{nf = Nearest[Flatten[Cases[Normal[plot], Line[p_, ___] :> p, Infinity], 1]]},
   Show[plot,
      Epilog ->
         Dynamic[DynamicModule[{
            pt = First[nf[MousePosition[{"Graphics", Graphics}, {0, 0}]]],
            scaled = Clip[MousePosition[{"GraphicsScaled", Graphics}, {0, 0}], {0, 1}]
            },
           {
            {If[scaled === None, {},
               {Lighter@Gray, Line[{
                   {Scaled[{scaled[[1]], 1}], Scaled[{scaled[[1]], 0}]},
                   {Scaled[{1, scaled[[2]]}], Scaled[{0, scaled[[2]]}]}
                   }]
               }]},
            {AbsolutePointSize[7], Point[pt], White, AbsolutePointSize[5], Point[pt]},
            Text[Style[NumberForm[Row[pt, ", "], {5, 2}], 12, Background -> White], Offset[{7, 0}, pt], {-1, 0}]}
         ]]
    ]
 ]
这是我躺在一起的例子。(我不喜欢自由浮动的落差线与点跟踪相结合,两者都感觉不错。)
Stack Overflow用户
发布于 2011-11-22 07:34:15
以下是您在评论中所要求的特性:
locatorPlot[func_, r : {var_, __}, other___] :=
 LocatorPane[
   Dynamic[pos, (pos = {#, func /. var -> #}) & @@ # &],
   Column[{Plot[func, r, other], Dynamic@pos}],
   AutoAction -> True,
   Appearance ->
     Graphics[{Gray, Line @ {{{-1, 0}, {1, 0}}, {{0, -1}, {0, 1}}}},
       ImageSize -> Full]
 ]

locatorPlot[AiryAi[z], {z, -11, 5}, ImageSize -> 400]
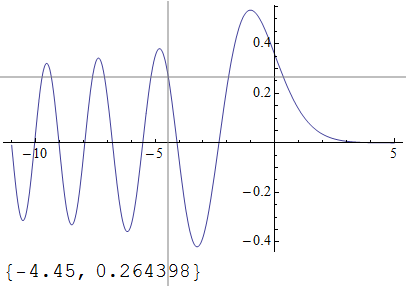
下面是一个处理新请求的相当笨重的更新:
locatorPlot[func_List, r : {var_, __}, other___] :=
 DynamicModule[{pos, pos2},
  LocatorPane[
   Dynamic[pos, (pos = #; (pos2 = {#, First@Nearest[func /. var -> #, #2]}) & @@ #) &],
   Plot[func, r, other,
     Epilog ->
      {Text[\[GrayCircle], Dynamic@pos2], Text[Dynamic@pos2, Dynamic@pos2, {-1.2, 0}]}
   ],
   AutoAction -> True,
   Appearance ->
     Graphics[{Gray, Line@{{{-1, 0}, {1, 0}}, {{0, -1}, {0, 1}}}}, ImageSize -> Full]
   ]
  ]

locatorPlot[{AiryAi[z], Sin[z]}, {z, -11, 5}, ImageSize -> 400]Stack Overflow用户
发布于 2011-11-22 11:11:12
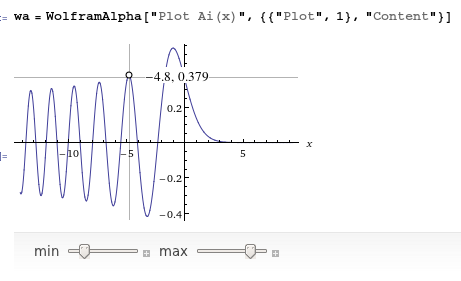
这里是我的版本,它的行为类似于Wolfram\Alpha输出,但它处理了多个图形。在W\A图形中,圆圈和文本跳转到最近的曲线,当光标不在图形上方时完全消失。添加缺失的功能并使代码更加灵活将是很好的。
WAPlot[fns_, range : {var_Symbol, __}] :=
 DynamicModule[{pos, fn = fns},
  If[Head[fn] === List, fn = First[Flatten[fn]]];
  LocatorPane[Dynamic[pos, (pos = {var, fn} /. var -> #[[1]]) &],
   Plot[fns, range, Method -> {"GridLinesInFront" -> True},
    GridLines->Dynamic[{{#,Gray}}&/@MousePosition[{"Graphics",Graphics},None]]],
   AutoAction -> True,
   Appearance -> Dynamic[Graphics[{Circle[pos, Scaled[.01]],
       Text[Framed[Row[pos, ", "], RoundingRadius -> 5,
         Background -> White], pos, {-1.3, 0}]}]]]]
然后,.
WAPlot[{{AiryAi[x], -AiryAi[x]}, AiryBi[x]}, {x, -10, 2}]
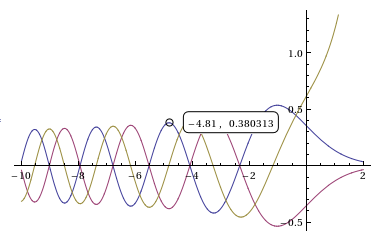
这是一个使用MousePosition而不是LocatorPane的新版本,它窃取W先生的代码,使圆圈移动到最近的曲线上。这种行为现在几乎与WolframAlpha输出完全相同。
WAPlot[fns_, range : {var_Symbol, __}] :=
 DynamicModule[{fnList = Flatten[{fns}]}, Plot[fnList, range,
   GridLines ->
    Dynamic[{{#, Gray}} & /@ MousePosition[{"Graphics", Graphics}]],
   Method -> {"GridLinesInFront" -> True},
   Epilog -> Dynamic[With[{mp = MousePosition[{"Graphics", Graphics}, None]},
      If[mp === None, {},
       With[{pos = {#1, First@Nearest[fnList /. var -> #1, #2]}& @@ mp},
        {Text[Style["\[EmptyCircle]", Medium, Bold], pos],
         Text[Style[NumberForm[Row[pos, ", "], 2], Medium], pos,
          {If[First[MousePosition["GraphicsScaled"]] < .5, -1.3, 1.3], 0},
          Background -> White]}]]]]
   ]]
输出看起来非常类似于上一个版本,所以我不会发布截图。
页面原文内容由Stack Overflow提供。腾讯云小微IT领域专用引擎提供翻译支持
原文链接:
https://stackoverflow.com/questions/8222733
复制相关文章
相似问题
腾讯云开发者

Copyright © 2013 - 2026 Tencent Cloud. All Rights Reserved. 腾讯云 版权所有
深圳市腾讯计算机系统有限公司 ICP备案/许可证号:粤B2-20090059 ![]() 粤公网安备44030502008569号
粤公网安备44030502008569号
腾讯云计算(北京)有限责任公司 京ICP证150476号 | 京ICP备11018762号