
Arctan Binning,从图到直方图,技巧
基于Sjoerd,很好的From Cartesian Plot to Polar Histogram using Mathematica解决方案和扩展,请考虑以下几点:
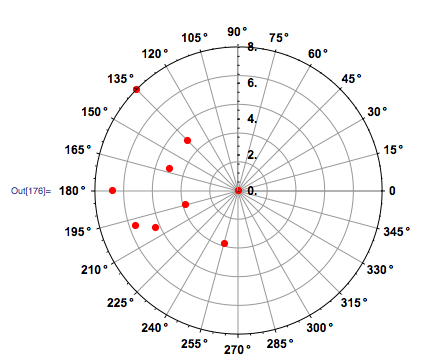
list = {{21, 16}, {16, 14}, {11, 11}, {11, 12},
        {13, 15}, {18, 17}, {19, 11}, {17, 16}, {16, 19}}

ScreenCenter = {20, 15}

ListPolarPlot[{ArcTan[##], EuclideanDistance[##]} & @@@ (# - ScreenCenter & /@ list),
              PolarAxes -> True, PolarGridLines -> Automatic, Joined -> False,
              PolarTicks -> {"Degrees", Automatic},
              BaseStyle -> {FontFamily -> "Arial", FontWeight -> Bold,
              FontSize -> 12}, PlotStyle -> {Red, PointSize -> 0.02}]
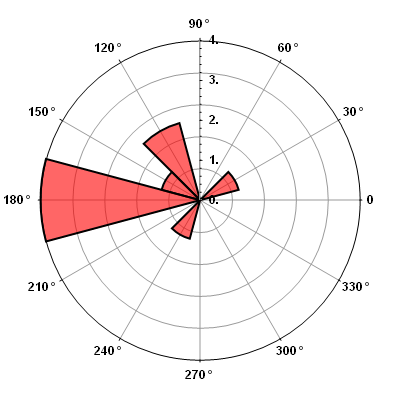
Module[{Countz, maxScale, angleDivisions, dAng},
        Countz = Reverse[BinCounts[Flatten@Map[ArcTan[#[[1]] - ScreenCenter[[1]], #[[2]] -
                 ScreenCenter[[2]]] &, list, {1}], {-\[Pi], \[Pi], \[Pi]/6}]];
        maxScale = 4;
        angleDivisions = 12;
        dAng = (2 \[Pi])/angleDivisions;

SectorChart[{ConstantArray[1, Length[Countz]], Countz}\[Transpose],
             SectorOrigin -> {-\[Pi]/angleDivisions, "Counterclockwise"},
             PolarAxes -> True,
             PolarGridLines -> Automatic,
             PolarTicks -> {Table[{i \[Degree] + \[Pi]/angleDivisions,i \[Degree]},
             {i, 0, 345, 30}], Automatic},
             ChartStyle -> {Directive[EdgeForm[{Black, Thickness[0.005]}], Red]},
             BaseStyle -> {FontFamily -> "Arial", FontWeight -> Bold,
             FontSize -> 12}, ImageSize -> 400]]
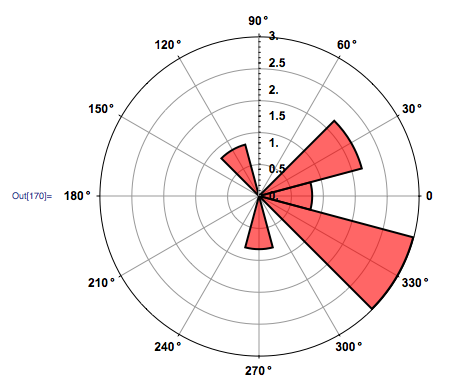
正如你所看到的,直方图显示了它应该旋转的对称性。我想尽一切办法把这些弄清楚,但没有成功。如果没有逆转,这是最糟糕的。我尝试了RotateRight但没有成功,我觉得问题出在我的BinCount上。ArcTan输出从-Pi到Pi,而Sjoerd建议我需要从0到2Pi。但我不知道怎么做。
编辑:问题解决了。多亏了Sjoerd,Belisarius,Heike的解决方案,我才能给出图像重心的眼睛定位的直方图。
回答 2
Stack Overflow用户
发布于 2011-09-17 20:35:44
您可以使用ChartElementFunction选项来准确定位扇区。ChartElementFunction的第一个参数是形式{{angleMin, angleMax}, {rMin,rMax}}。第一个扇区有边界{angleMin, angleMax} = {-Pi/12, Pi/12},第二个扇区有{Pi/12, 3 Pi/12}等等。因此,为了得到正确的旋转,您可以这样做
Module[{Countz, maxScale, angleDivisions, dAng},
 maxScale = 4;
 angleDivisions = 12;
 dAng = (2 \[Pi])/angleDivisions;
 Countz = BinCounts[
   Flatten@Map[ArcTan @@ (# - ScreenCenter) &, list, {1}],
    {-Pi, Pi, dAng}];

 SectorChart[{ConstantArray[1, Length[Countz]], Countz}\[Transpose],
  SectorOrigin -> {-\[Pi]/angleDivisions, "Counterclockwise"},
  PolarAxes -> True, PolarGridLines -> Automatic,
  PolarTicks -> {Table[{i \[Degree] + \[Pi]/angleDivisions,
      i \[Degree]}, {i, 0, 345, 30}], Automatic},
  ChartStyle -> {Directive[EdgeForm[{Black, Thickness[0.005]}], Red]},
  BaseStyle -> {FontFamily -> "Arial", FontWeight -> Bold, FontSize -> 12},
  ImageSize -> 400,

  ChartElementFunction ->
   Function[{range}, Disk[{0, 0}, range[[2, 2]], - 11 Pi/12 + range[[1]]]]]]
Stack Overflow用户
发布于 2011-09-17 20:18:49
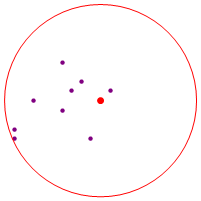
现在只是检查一下,但你的第一个情节似乎有缺陷:
list = {{21, 16}, {16, 14}, {11, 11}, {11, 12}, {13, 15},
        {18, 17}, {19, 11}, {17, 16}, {16, 19}};
ScreenCenter = {20, 15};

Show[ListPlot[list, PlotStyle -> Directive[PointSize[Medium], Purple]],
     Graphics[
              {Red, PointSize[Large], Point[ScreenCenter],
               Circle[ScreenCenter, 10]}],
AspectRatio -> 1, Axes -> False]
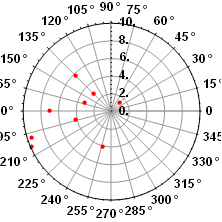
ListPolarPlot[{ArcTan[Sequence @@ ##], Norm[##]} &/@ (#-ScreenCenter & /@ list),
 PolarAxes -> True,
 PolarGridLines -> Automatic,
 Joined -> False,
 PolarTicks -> {"Degrees", Automatic},
 BaseStyle -> {FontFamily -> "Arial", FontWeight -> Bold, FontSize -> 12},
 PlotStyle -> {Red, PointSize -> 0.02}]
编辑
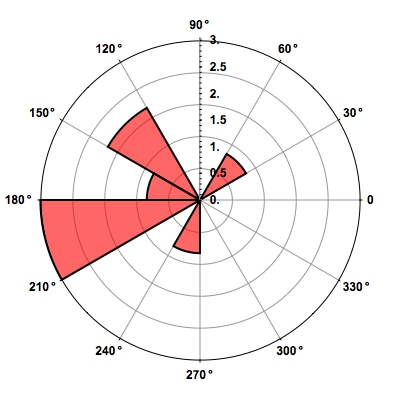
我没有遵循您的所有代码,但是屏幕中心上的反射似乎解决了这个问题:
Module[{Countz, maxScale, angleDivisions, dAng},
 Countz = BinCounts[
               {ArcTan[Sequence @@ ##]} & /@ (# + ScreenCenter & /@ -list),
           {-Pi, Pi, Pi/6}];
 maxScale = 4;
 angleDivisions = 12;
 dAng = (2 Pi)/angleDivisions;

 SectorChart[{ConstantArray[1, Length[Countz]], Countz}\[Transpose],

  SectorOrigin -> {-Pi/angleDivisions, "Counterclockwise"},
  PolarAxes -> True,
  PolarGridLines -> Automatic,
  PolarTicks -> {Table[{i \[Degree] + Pi/angleDivisions,
                        i \[Degree]}, {i, 0, 345, 30}], Automatic},
  ChartStyle -> {Directive[EdgeForm[{Black, Thickness[0.005]}], Red]},
   BaseStyle -> {FontFamily -> "Arial", FontWeight -> Bold,
    FontSize -> 12},
   ImageSize -> 400]]
编辑
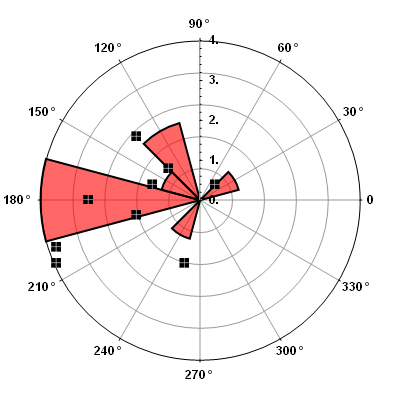
在这里,您可能会看到我的代码中的小错误,这在海克的回答中得到了解决(投票支持它!)
Show[Module[{Countz, maxScale, angleDivisions, dAng},
  Countz = BinCounts[{ArcTan[
        Sequence @@ ##]} & /@ (# +
         ScreenCenter & /@ -list), {-\[Pi], \[Pi], \[Pi]/6}];
  maxScale = 4;
  angleDivisions = 12;
  dAng = (2 \[Pi])/angleDivisions;
  SectorChart[{ConstantArray[1, Length[Countz]], Countz}\[Transpose],
   SectorOrigin -> {-\[Pi]/angleDivisions, "Counterclockwise"},
   PolarAxes -> True, PolarGridLines -> Automatic,
   PolarTicks -> {Table[{i \[Degree] + \[Pi]/angleDivisions,
       i \[Degree]}, {i, 0, 345, 30}], Automatic},
   ChartStyle -> {Directive[EdgeForm[{Black, Thickness[0.005]}],
      Red]}, BaseStyle -> {FontFamily -> "Arial", FontWeight -> Bold,
     FontSize -> 12}, ImageSize -> 400]],
 ListPlot[Plus[# - ScreenCenter] & /@ list/2.5,
  PlotMarkers -> Image[CrossMatrix[10], ImageSize -> 10]]
 ]
https://stackoverflow.com/questions/7457254
复制相似问题
腾讯云开发者

Copyright © 2013 - 2026 Tencent Cloud. All Rights Reserved. 腾讯云 版权所有
深圳市腾讯计算机系统有限公司 ICP备案/许可证号:粤B2-20090059 ![]() 粤公网安备44030502008569号
粤公网安备44030502008569号
腾讯云计算(北京)有限责任公司 京ICP证150476号 | 京ICP备11018762号