
Visifire调查
Visifire调查
提问于 2011-09-15 08:34:06
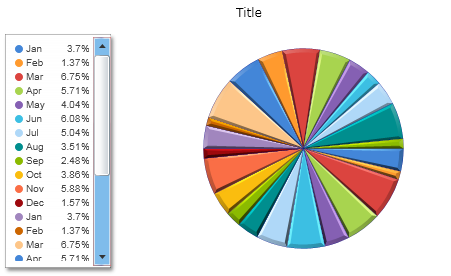
是否有方法更改Visifire XAML中饼形图图例的垂直滚动查看器的滚动查看器样式?
这是我的代码:
<visifire:Chart x:Name="EmployeeMasterFileChart" HorizontalAlignment="Stretch" VerticalAlignment="Stretch" BorderThickness="0" Background="{x:Null}" Margin="0,0,0,0" Padding="4,0,4,4" MaxWidth="500">
                        <visifire:Chart.PlotArea>
                            <visifire:PlotArea Background="Transparent" />
                        </visifire:Chart.PlotArea>
                        <visifire:Chart.Legends>
                            <visifire:Legend x:Name="Legend0" HorizontalAlignment="Left" VerticalAlignment="Center" EntryMargin="5"
                            Padding="10" FontSize="10" FontWeight="Normal" ShadowEnabled="False" BorderThickness="0" Background="Transparent" LightingEnabled="False"/>
                        </visifire:Chart.Legends>

                        <visifire:Chart.Titles>
                            <visifire:Title FontSize="12" Text="Title" Margin="0,10,0,0" />
                        </visifire:Chart.Titles>

                        <visifire:Chart.Series>

                            <visifire:DataSeries RenderAs="Pie" LabelEnabled="false" Bevel="True" ShadowEnabled="true" Cursor="Hand"
                                LightingEnabled="False" BorderColor="DarkBlue"
                                BorderThickness=".24" ShowInLegend="True" IncludePercentageInLegend="True">

                                <visifire:DataSeries.DataPoints>
                                    <visifire:DataPoint AxisXLabel="Jan" YValue="5509"/>
                                    <visifire:DataPoint AxisXLabel="Feb" YValue="2047"/>
                                    <visifire:DataPoint AxisXLabel="Mar" YValue="10047"/>
                                    <visifire:DataPoint AxisXLabel="Apr" YValue="8508"/>
                                    <visifire:DataPoint AxisXLabel="May" YValue="6022"/>
                                    <visifire:DataPoint AxisXLabel="Jun" YValue="9047"/>
                                    <visifire:DataPoint AxisXLabel="Jul" YValue="7508"/>
                                    <visifire:DataPoint AxisXLabel="Aug" YValue="5222"/>
                                    <visifire:DataPoint AxisXLabel="Sep" YValue="3698"/>
                                    <visifire:DataPoint AxisXLabel="Oct" YValue="5754"/>
                                    <visifire:DataPoint AxisXLabel="Nov" YValue="8756"/>
                                    <visifire:DataPoint AxisXLabel="Dec" YValue="2340"/>
                                </visifire:DataSeries.DataPoints>

                            </visifire:DataSeries>
                        </visifire:Chart.Series>
</visifire:Chart>回答 1
Stack Overflow用户
发布于 2011-09-15 11:52:13
我猜您想要更改图例的垂直滚动查看器的ScrollBar样式
目前,没有直接的选项来设置垂直ScrollBar的样式在垂直ScrollViewer中出现在图例中。但你可以试试下面的解决办法。
您只需要在图表的范围内为ScrollBar创建一个全局样式。为ScrollBar设置模板属性,并根据需要对其进行修改。查看下面的示例。
XAML
 <vc:Chart Height="300" Width="500">
            <vc:Chart.Resources>
                <Style TargetType="ScrollBar">
                    <Setter Property="Template">
                        <Setter.Value>
                            <ControlTemplate TargetType="ScrollBar">
                             ..................
                             ......Here you need to edit Template of the ScrollBar....
                             ..................
                            </ControlTemplate>
                        </Setter.Value>
                    </Setter>
                </Style>

            </vc:Chart.Resources>
            <vc:Chart.Titles>
                <vc:Title FontSize="12" Text="Title" Margin="0,10,0,0" />
            </vc:Chart.Titles>
            <vc:Chart.Legends>
                <vc:Legend HorizontalAlignment="Left"  VerticalAlignment="Center"></vc:Legend>
            </vc:Chart.Legends>

            <vc:Chart.Series>

                <vc:DataSeries RenderAs="Pie" LabelEnabled="false" Bevel="True" ShadowEnabled="true" Cursor="Hand"
                    LightingEnabled="False" BorderColor="DarkBlue"
                    BorderThickness=".24" ShowInLegend="True" IncludePercentageInLegend="True">

                    <vc:DataSeries.DataPoints>
                        <vc:DataPoint AxisXLabel="Jan" YValue="5509"/>
                        <vc:DataPoint AxisXLabel="Feb" YValue="2047"/>
                        <vc:DataPoint AxisXLabel="Mar" YValue="10047"/>
                        <vc:DataPoint AxisXLabel="Apr" YValue="8508"/>
                        <vc:DataPoint AxisXLabel="May" YValue="6022"/>
                        <vc:DataPoint AxisXLabel="Jun" YValue="9047"/>
                        <vc:DataPoint AxisXLabel="Jul" YValue="7508"/>
                        <vc:DataPoint AxisXLabel="Aug" YValue="5222"/>
                        <vc:DataPoint AxisXLabel="Sep" YValue="3698"/>
                        <vc:DataPoint AxisXLabel="Oct" YValue="5754"/>
                        <vc:DataPoint AxisXLabel="Nov" YValue="8756"/>
                        <vc:DataPoint AxisXLabel="Dec" YValue="2340"/>
                    </vc:DataSeries.DataPoints>

                </vc:DataSeries>
            </vc:Chart.Series>
</vc:Chart>您可以从下面的链接下载setting-scrollbar-style-in-legend-workarround.zip文件。
https://skydrive.live.com/?cid=61995e3895be1728&sc=documents&id=61995E3895BE1728%21125#
页面原文内容由Stack Overflow提供。腾讯云小微IT领域专用引擎提供翻译支持
原文链接:
https://stackoverflow.com/questions/7428005
复制相关文章
相似问题
腾讯云开发者

Copyright © 2013 - 2026 Tencent Cloud. All Rights Reserved. 腾讯云 版权所有
深圳市腾讯计算机系统有限公司 ICP备案/许可证号:粤B2-20090059 ![]() 粤公网安备44030502008569号
粤公网安备44030502008569号
腾讯云计算(北京)有限责任公司 京ICP证150476号 | 京ICP备11018762号