
在图像中定位桥型结构的端点
在图像中定位桥型结构的端点
提问于 2011-05-30 07:30:06
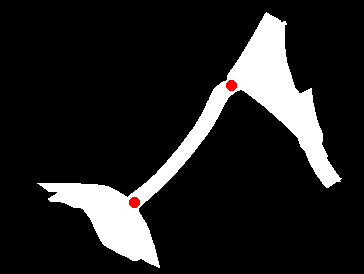
如何在图像中定位桥型结构的端点?
下面是一个广义表示。
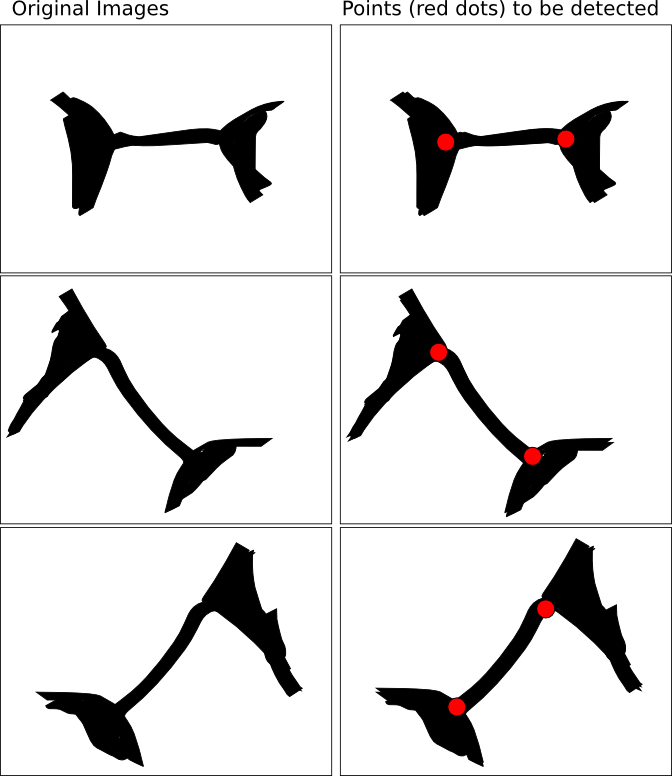
我有一组图片,看起来像你在左边的列上看到的,如上面的图片所示。我试图检测/定位的实际上是上面图片中右边列上显示的两个端点。这就像“桥”的“两头”定位一样。
我已经应用了一些基本的形态操作;但是,要么我做错了,要么那些基本的形态操作在这个场景中不起作用。(我试着把它做成骷髅,但是,一旦骨架形成,我似乎就无法检测出三边的十字)。
编辑
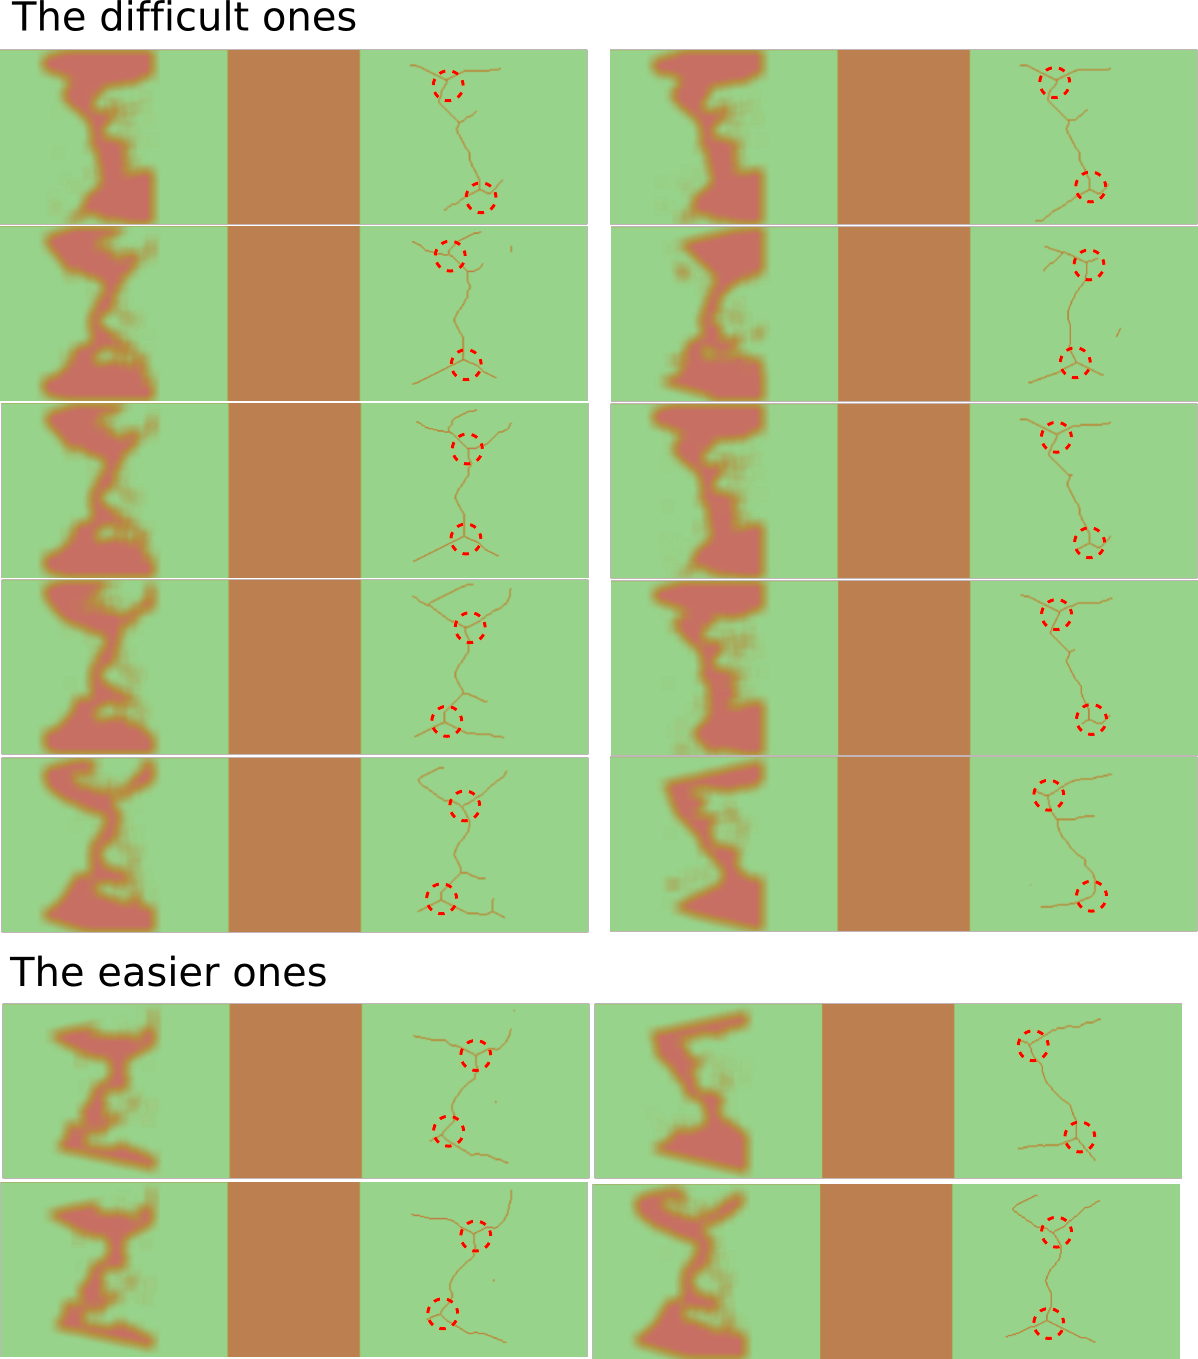
感谢前面的建议;但是,看起来原始图像集不能像我以前画的那样被完全概括。
我已附上这一问题的最新情况。下面是一个更详细的表示,包括原来的分割区域和相应的图像,经历了“细化”的形态学操作。同样,左侧是原来分割的区域,而右边是要检测的点。
回答 6
Stack Overflow用户
回答已采纳
发布于 2011-06-01 02:57:38
下面是一个代码示例,用于在对图像进行骨架化之后定位分支点:
import pymorph as m
import mahotas
from numpy import array

image = mahotas.imread('1.png') # load image

b1 = image[:,:,1] < 150 # make binary image from thresholded green channel

b2 = m.thin(b1) # create skeleton
b3 = m.thin(b2, m.endpoints('homotopic'), 15) # prune small branches, may need tuning

# structuring elements to search for 3-connected pixels
seA1 = array([[False,  True, False],
       [False,  True, False],
       [ True, False,  True]], dtype=bool)

seB1 = array([[False, False, False],
       [ True, False,  True],
       [False,  True, False]], dtype=bool)

seA2 = array([[False,  True, False],
       [ True,  True,  True],
       [False, False, False]], dtype=bool)

seB2 = array([[ True, False,  True],
       [False, False, False],
       [False,  True, False]], dtype=bool)

# hit or miss templates from these SEs
hmt1 = m.se2hmt(seA1, seB1)
hmt2 = m.se2hmt(seA2, seB2)

# locate 3-connected regions
b4 = m.union(m.supcanon(b3, hmt1), m.supcanon(b3, hmt2))

# dilate to merge nearby hits
b5 = m.dilate(b4, m.sedisk(10))

# locate centroids
b6 = m.blob(m.label(b5), 'centroid')

outputimage = m.overlay(b1, m.dilate(b6,m.sedisk(5)))
mahotas.imsave('output.png', outputimage)
Stack Overflow用户
发布于 2011-05-30 19:11:48
使用Python、NumPy、毕莫夫和毛豪斯的解决方案
import pymorph as m
import mahotas
from numpy import where, reshape

image = mahotas.imread('input.png') # Load image

b1 = image[:,:,0] < 100 # Make a binary image from the thresholded red channel
b2 = m.erode(b1, m.sedisk(4)) # Erode to enhance contrast of the bridge
b3 = m.open(b2,m.sedisk(4)) # Remove the bridge
b4 = b2-b3 # Bridge plus small noise
b5 = m.areaopen(b4,1000) # Remove small areas leaving only a thinned bridge
b6 = m.dilate(b3)*b5 # Extend the non-bridge area slightly and get intersection with the bridge.

#b6 is image of end of bridge, now find single points
b7 = m.thin(b6, m.endpoints('homotopic')) # Narrow regions to single points.
labelled = m.label(b7) # Label endpoints.

x1, y1 = reshape(where(labelled == 1),(1,2))[0]
x2, y2 = reshape(where(labelled == 2),(1,2))[0]

outputimage = m.overlay(b1, m.dilate(b7,m.sedisk(5)))
mahotas.imsave('output.png', outputimage)
Stack Overflow用户
发布于 2011-05-30 16:05:24
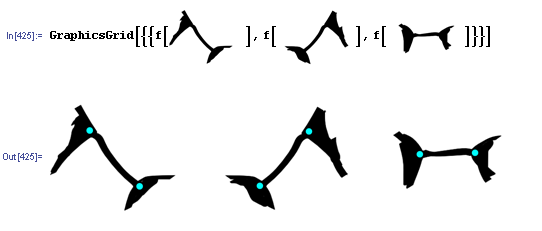
这里有一个数学中的代码示例,可能不是最优的:
f[i_] :=
   Module[{t, i2, w, z, neighbours, i3, cRed},
  (t = Thinning[ColorNegate@i, 15];
   i2 = ImageData@Binarize[ DeleteSmallComponents[
        ImageSubtract[t, Dilation[Erosion[t, 1], 1]], 100], .1];

    For[w = 2, w < Dimensions[i2][[1]], w++,
     For[z = 2, z < Dimensions[i2][[2]], z++,
      If[i2[[w, z]] == 1 && i2[[w + 1, z + 1]] == 1,
         i2[[w, z + 1]] = i2[[w + 1, z]] = 0];
      If[i2[[w, z]] == i2[[w - 1, z - 1]] == 1,
         i2[[w, z - 1]] = i2[[w - 1, z]] = 0];
      If[i2[[w, z]] == i2[[w + 1, z - 1]] == 1,
         i2[[w, z - 1]] = i2[[w + 1, z]] = 0];
      If[i2[[w, z]] == i2[[w - 1, z + 1]] == 1,
         i2[[w, z + 1]] = i2[[w - 1, z]] = 0];
      ]
     ];

    neighbours[l_, k_, j_] :=
      l[[k - 1, j]] +     l[[k + 1, j]] +     l[[k, j + 1]] + l[[k, j - 1]] +
      l[[k + 1, j + 1]] + l[[k + 1, j - 1]] + l[[k - 1, j + 1]] +
      l[[k - 1, j - 1]];

    i3 = Table[
      If[i2[[w, z]] ==1,neighbours[i2, w, z], 0],{w,2,Dimensions[i2][[1]]-1},
                                                 {z,2,Dimensions[i2][[2]]-1}];
    cRed =
     ColorNegate@Rasterize[Graphics[{Red, Disk[]}], ImageSize -> 15];

    ImageCompose[
     ImageCompose[i,
      cRed, {#[[2]], Dimensions[i2][[1]] - #[[1]]} &@
       Position[i3, 1][[1]]],
      cRed, {#[[2]], Dimensions[i2][[1]] - #[[1]]} &@
       Position[i3, 1][[2]]])];
页面原文内容由Stack Overflow提供。腾讯云小微IT领域专用引擎提供翻译支持
原文链接:
https://stackoverflow.com/questions/6173424
复制相关文章
相似问题
腾讯云开发者

Copyright © 2013 - 2026 Tencent Cloud. All Rights Reserved. 腾讯云 版权所有
深圳市腾讯计算机系统有限公司 ICP备案/许可证号:粤B2-20090059 ![]() 粤公网安备44030502008569号
粤公网安备44030502008569号
腾讯云计算(北京)有限责任公司 京ICP证150476号 | 京ICP备11018762号