
matplotlib或其他python包中的3D饼图
matplotlib或其他python包中的3D饼图
提问于 2010-08-09 01:04:51
是否有一种方法可以在matplotlib中呈现一个3D饼,还是有一个Python包可以生成3D馅饼?
编辑:--实际上我已经知道了pygooglechart,但是我正在寻找一些可以脱机执行的东西。我很抱歉忘了包括这些信息。对于那些提供pygooglechart的人,谢谢你们的努力,你们得到了我的选票。更多的想法仍有待商榷。
回答 2
Stack Overflow用户
回答已采纳
发布于 2010-08-09 02:40:07
PyPi: pygooglechat 0.4.0:发布日期:2014年4月20日
GitHub: pygooglechart:项目废弃的
例如:
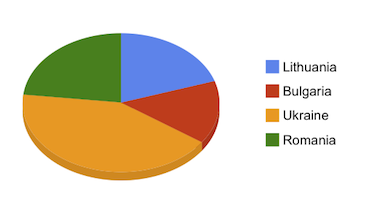
from pygooglechart import PieChart3D

def python_pie3D() :
  # initialize chart object, 250 x 250 pixels
  chart = PieChart3D(250, 250)

  # pass your data to the chart object
  chart.add_data([398, 294, 840, 462])

  # make labels for the slices
  chart.set_pie_labels("Lithuania Bulgaria Ukraine Romania".split())

  # render the image
  chart.download('revenue_east_europe.png')
Stack Overflow用户
发布于 2019-10-15 19:38:26
from pychartdir import *

#Data
data = [50, 12, 3,35]

# Labels
labels = ["a", "b", "c", "d"]

# Set pixel
c= PieChart(500, 300)

# set center
c.setPieSize(250, 140, 100)

# Add title
c.addTitle("title")

# Draw
c.set3D()

# Set lebel
c.setData(data, labels)

# Explode all
c.setExplode()

# Output
c.makeChart("threedpie.png")页面原文内容由Stack Overflow提供。腾讯云小微IT领域专用引擎提供翻译支持
原文链接:
https://stackoverflow.com/questions/3436755
复制相关文章
相似问题
腾讯云开发者

Copyright © 2013 - 2026 Tencent Cloud. All Rights Reserved. 腾讯云 版权所有
深圳市腾讯计算机系统有限公司 ICP备案/许可证号:粤B2-20090059 ![]() 粤公网安备44030502008569号
粤公网安备44030502008569号
腾讯云计算(北京)有限责任公司 京ICP证150476号 | 京ICP备11018762号