
图为熊猫多Y轴图
图为熊猫多Y轴图
提问于 2021-11-07 14:36:52
有人能给我一个提示,告诉我如何在我的情节中加入一个传奇吗?我很满意剧情的样子,只是需要一个传说:)
# data from pandas df's
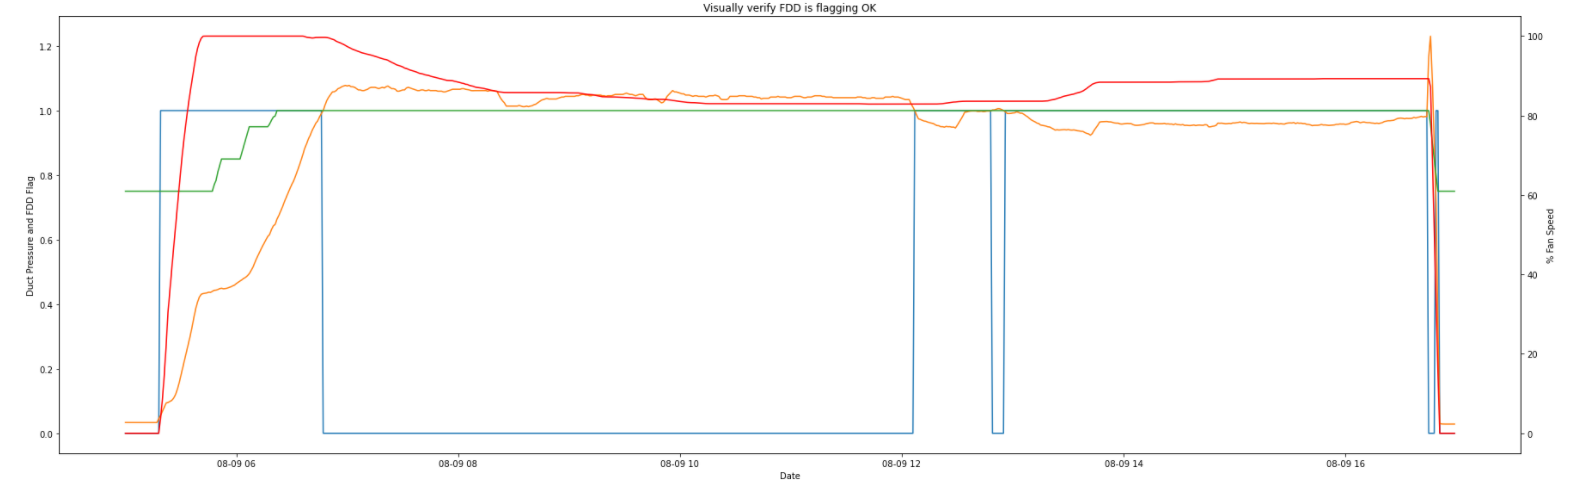
zoom_plot = fc1_dataset.loc['2021-8-9'].between_time('5:00', '17:00')
_no_vfd_sig = zoom_plot[['fc1_flag','duct_static','duct_static_setpoint']]
_vfdsig = zoom_plot.vfd_speed
# using subplots() function
fig, ax = plt.subplots(figsize=(25,8))
plt.title('Visually verify FDD is flagging OK')
# using the twinx() for creating another
# axes object for secondary y-Axis
ax2 = ax.twinx()
ax.plot(zoom_plot.index, _no_vfd_sig)
ax2.plot(zoom_plot.index, _vfdsig, color = 'r')
# giving labels to the axises
ax.set_xlabel('Date')
ax.set_ylabel('Duct Pressure and FDD Flag')
# secondary y-axis label
ax2.set_ylabel('% Fan Speed')
# defining display layout
plt.tight_layout()
# show plot
plt.show()输出:
回答 1
Stack Overflow用户
回答已采纳
发布于 2021-11-07 15:27:33
和之前的代码一样。
plot1, = ax.plot(zoom_plot.index, _no_vfd_sig)
plot2, = ax2.plot(zoom_plot.index, _vfdsig, color = 'r')

ax.set_xlabel('Date')
ax.set_ylabel('Duct Pressure and FDD Flag')

# secondary y-axis label
ax2.set_ylabel('% Fan Speed')

plt.legend([plot1,plot2],["plot 1", "plot 2"])

# defining display layout
plt.tight_layout()

# show plot
plt.show()页面原文内容由Stack Overflow提供。腾讯云小微IT领域专用引擎提供翻译支持
原文链接:
https://stackoverflow.com/questions/69873400
复制相关文章
相似问题
腾讯云开发者

Copyright © 2013 - 2026 Tencent Cloud. All Rights Reserved. 腾讯云 版权所有
深圳市腾讯计算机系统有限公司 ICP备案/许可证号:粤B2-20090059 ![]() 粤公网安备44030502008569号
粤公网安备44030502008569号
腾讯云计算(北京)有限责任公司 京ICP证150476号 | 京ICP备11018762号