
如何获取每个目标的内存使用量
我一直在与普罗米修斯和格拉法纳合作,在那里我试图将两者结合在一起。我目前的问题是,我的节点导出程序目前正在重定向到端口9100,这是我能够做到的:
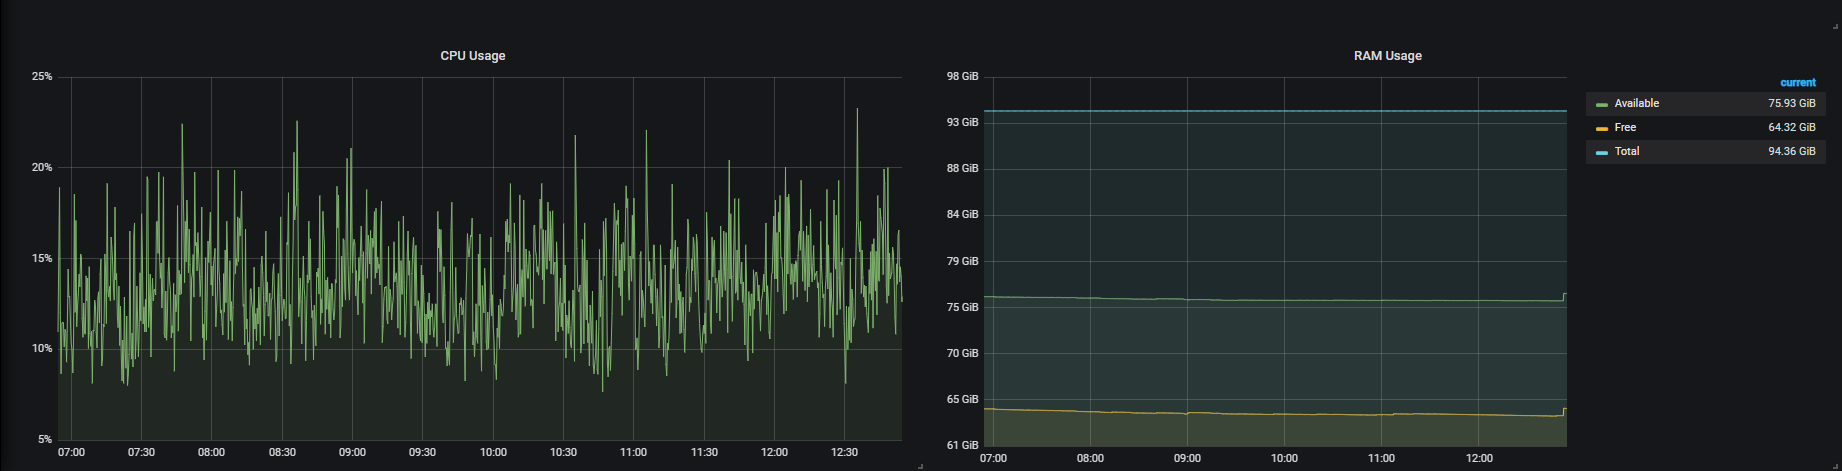
不过,这只是总结整个计算机状态,但我想要做的是,我希望获得每个目标的RAM使用情况:
# Sample config for Prometheus.

global:
  scrape_interval:     1s # Set the scrape interval to every 15 seconds. Default is every 1 minute.
  evaluation_interval: 1s # Evaluate rules every 15 seconds. The default is every 1 minute.
  # scrape_timeout is set to the global default (10s).

  # Attach these labels to any time series or alerts when communicating with
  # external systems (federation, remote storage, Alertmanager).
  external_labels:
      monitor: 'example'

# Alertmanager configuration
alerting:
  alertmanagers:
  - static_configs:
    - targets: ['localhost:9093']

# Load rules once and periodically evaluate them according to the global 'evaluation_interval'.
rule_files:
  # - "first_rules.yml"
  # - "second_rules.yml"

# A scrape configuration containing exactly one endpoint to scrape:
# Here it's Prometheus itself.
scrape_configs:

  - job_name: node
    # If prometheus-node-exporter is installed, grab stats about the local
    # machine by default.
    static_configs:
      - targets: [
                  'localhost:8000',
                  'localhost:8001',
                  'localhost:8002',
                  'localhost:8003',
                  'localhost:8004',
                  'localhost:8005',
                  'localhost:8006',
                  'localhost:8007',
                  'localhost:8008',
                  'localhost:8009',
                  'localhost:8010',
                  'localhost:8011',
                  'localhost:8012',
                  'localhost:8013',
                  'localhost:8014',
                  'localhost:8015',
                  'localhost:8016',
                  'localhost:8002',
                  'localhost:8017',
                  'localhost:8018',
                  'localhost:8019',
                  'localhost:8020',
                  'localhost:8021',
                  'localhost:8022',
                  'localhost:8023',
                  'localhost:8024',
                  'localhost:8025',
                  'localhost:8026',
                  'localhost:8027',
                  'localhost:8028',
                  'localhost:8029',
                  'localhost:8030',
                  'localhost:8030',
                  'localhost:8031',
                  'localhost:8032',
                  'localhost:8033',
                  'localhost:8034',
                  'localhost:8035',
                  'localhost:8036',
                  'localhost:8037',
                  'localhost:8038',
                  'localhost:8039',
                  'localhost:8040',
                  'localhost:9100'
                ]
现在,我被困在不知道如何或是否可能得到不同端口使用的RAM的地方?
我想做的输出是:
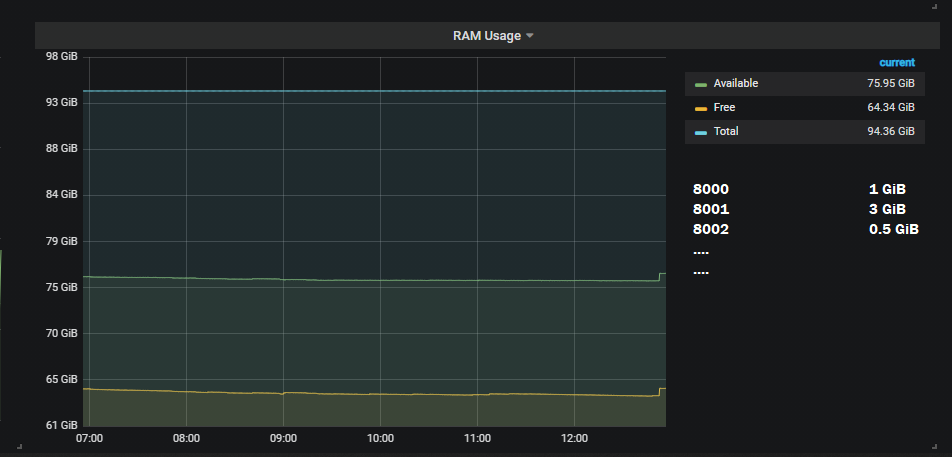
编辑:
如何为每个节点运行一个节点导出程序,并使用实例标签来区分不同的节点/计算机?
回答 1
Stack Overflow用户
发布于 2021-09-21 12:45:40
为历史目的保留此部分:默认情况下,您的度量系列在刮擦时会被赋予标签。最小值是job和instance__。例如,如果您的度量系列是node_memory_MemAvailable_bytes,您可以从您的目标中选择该系列作为node_memory_MemAvailable_bytes{instance="localhost:9100"},这适用于任何类型的度量。附带注意:如果您在服务器上运行了多个node_exporter,您将不会看到不同的信息。
编辑:
声明的问题是@ProtractorNewbie希望能够从单个服务器导出CPU使用情况。理想情况下,他们希望使用node_exporter。
如今,node_exporter还没有一种按进程提供进程信息的方法。
但是,一种可能的方法是将collectd与配置和启用的cgroups和write_prometheus插件一起使用。
然后,您将需要每个服务作为systemd服务运行。
您希望使用的数据如下所示:
collectd_cgroups_cpu_total{cgroups="myservice.service",type="user",instance="myinstancename"} 0 1632740881417从那里你可以做任何典型的普罗米修斯操作。
https://stackoverflow.com/questions/69233998
复制相似问题
腾讯云开发者

Copyright © 2013 - 2026 Tencent Cloud. All Rights Reserved. 腾讯云 版权所有
深圳市腾讯计算机系统有限公司 ICP备案/许可证号:粤B2-20090059 ![]() 粤公网安备44030502008569号
粤公网安备44030502008569号
腾讯云计算(北京)有限责任公司 京ICP证150476号 | 京ICP备11018762号