
使用geopandas +地图崩溃会话绘制热图(内核密度)
使用geopandas +地图崩溃会话绘制热图(内核密度)
提问于 2021-09-07 14:42:11
最近,我在一个问题上发布了如何用地质公园绘制热图。有人建议我使用geoplot.kdeplot(),但是传递一个projection会使我的会话崩溃。
假设我的数据分别存储在df_points和df_map中:
> print(df_points)
        PointID                     geometry
0     204403876  POINT (-101.66700 21.11670)
1     204462769  POINT (-101.66700 21.11670)
2     144407530  POINT (-101.66700 21.11670)

> print(df_map)
     PolyID                                           geometry
0     01001  POLYGON ((-102.10641 22.06035, -102.10368 22.0...
1     01002  POLYGON ((-102.05189 22.29144, -102.05121 22.2...
2 01003 POLYGON ((-102.68569 22.09963, -102.69087 22.0...这是我尝试过的,但是根据本教程,我应该将一个projection传递给热图。
# Import geoplot
import geoplot
import geoplot.crs as gcrs
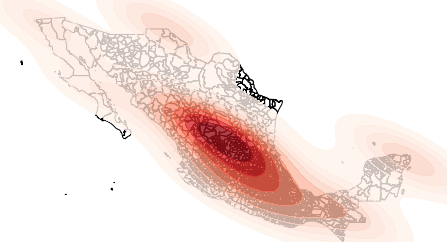
# Plot points
ax = geoplot.kdeplot(df_points, shade=True, alpha=0.7)
# Plot polygons
geoplot.polyplot(df_map, ax=ax)
但是,如果我添加了projection=gcrs.AlbersEqualArea(),会话就会崩溃:
# Plot heatmap
ax = geoplot.kdeplot(df_points, cmap='Reds', shade=True,
                     projection=gcrs.AlbersEqualArea()) # This crashes my session ):
# Add polygons
geoplot.polyplot(df_map, ax=ax)
python3: geos_ts_c.cpp:3991: int GEOSCoordSeq_getSize_r(GEOSContextHandle_t,const::geom::协调员序列*,无符号int*):断言‘0 != cs’失败。
如何传递projection=gcrs.AlbersEqualArea()并避免错误?
回答 1
Stack Overflow用户
回答已采纳
发布于 2021-09-08 03:45:43
我是在评论前面的一个问题:我刚刚在Colab的官方地理图引用中运行了这个例子,并经历了类似的崩溃。经过一些研究后,我发现崩溃是由shaply、卸载和重新安装造成的,并按照引用显示了图表。请试试看。
pip uninstall shapely
pip install shapely --no-binary shapely以下是帮助我的答案
页面原文内容由Stack Overflow提供。腾讯云小微IT领域专用引擎提供翻译支持
原文链接:
https://stackoverflow.com/questions/69090235
复制相关文章
相似问题
腾讯云开发者

Copyright © 2013 - 2026 Tencent Cloud. All Rights Reserved. 腾讯云 版权所有
深圳市腾讯计算机系统有限公司 ICP备案/许可证号:粤B2-20090059 ![]() 粤公网安备44030502008569号
粤公网安备44030502008569号
腾讯云计算(北京)有限责任公司 京ICP证150476号 | 京ICP备11018762号