
右对齐水平海运标线
右对齐水平海运标线
提问于 2021-08-20 07:20:45
如何使水平的海运基准图右对齐/镜像?
import matplotlib.pyplot as plt
import seaborn as sns

x = ['x1', 'x2', 'x3']
y = [4, 6, 3]
sns.barplot(x=y, y=x, orient='h')
plt.show()
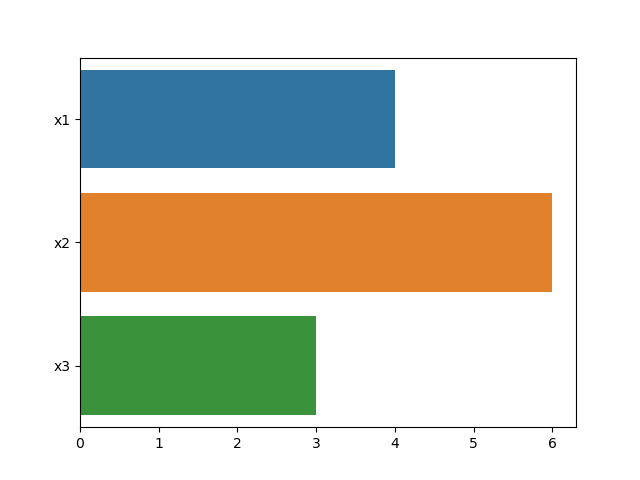
默认的水平桶图如下所示
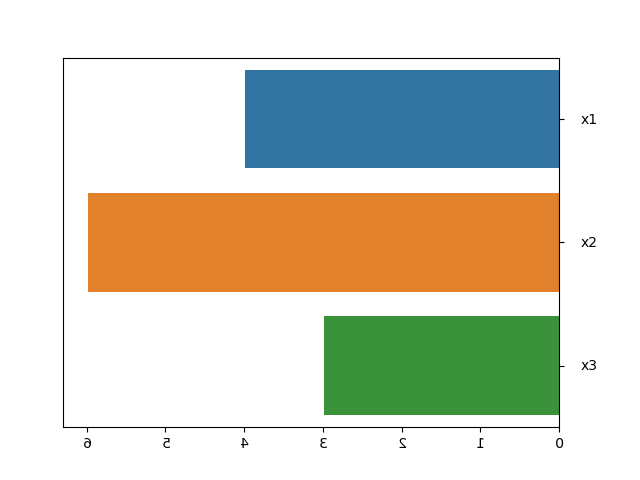
我想要这样的东西(配上合适的xticks)。
回答 2
Stack Overflow用户
回答已采纳
发布于 2021-08-20 07:57:59
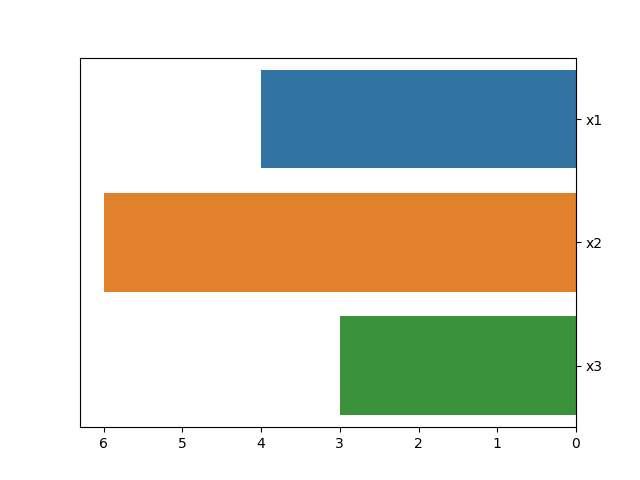
为了使x轴倒转,您可以使用:
ax.invert_xaxis()然后,为了将标签向右移动,可以使用:
plt.tick_params(axis = 'y', left = False, right = True, labelleft = False, labelright = True)或者,更短:
ax.yaxis.tight_right()完整代码
import matplotlib.pyplot as plt
import seaborn as sns

x = ['x1', 'x2', 'x3']
y = [4, 6, 3]
ax = sns.barplot(x=y, y=x, orient='h')

ax.invert_xaxis()
ax.yaxis.tick_right()

plt.show()
Stack Overflow用户
发布于 2021-08-20 07:55:18
您只需更改matplotlib x轴限制即可。实现此操作的一个简单方法是捕获sns.barplot返回的sns.barplot实例,然后在其上使用ax.set_xlim。
然后,您可以使用ax.yaxis.set_label_position('right')和ax.yaxis.set_ticks_position('right')将滴答和轴标签移到右边。
例如:
import matplotlib.pyplot as plt
import seaborn as sns

x = ['x1', 'x2', 'x3']
y = [4, 6, 3]
ax = sns.barplot(x=y, y=x, orient='h')
ax.set_xlim(ax.get_xlim()[1], ax.get_xlim()[0])

ax.yaxis.set_label_position('right')
ax.yaxis.set_ticks_position('right')

plt.show()
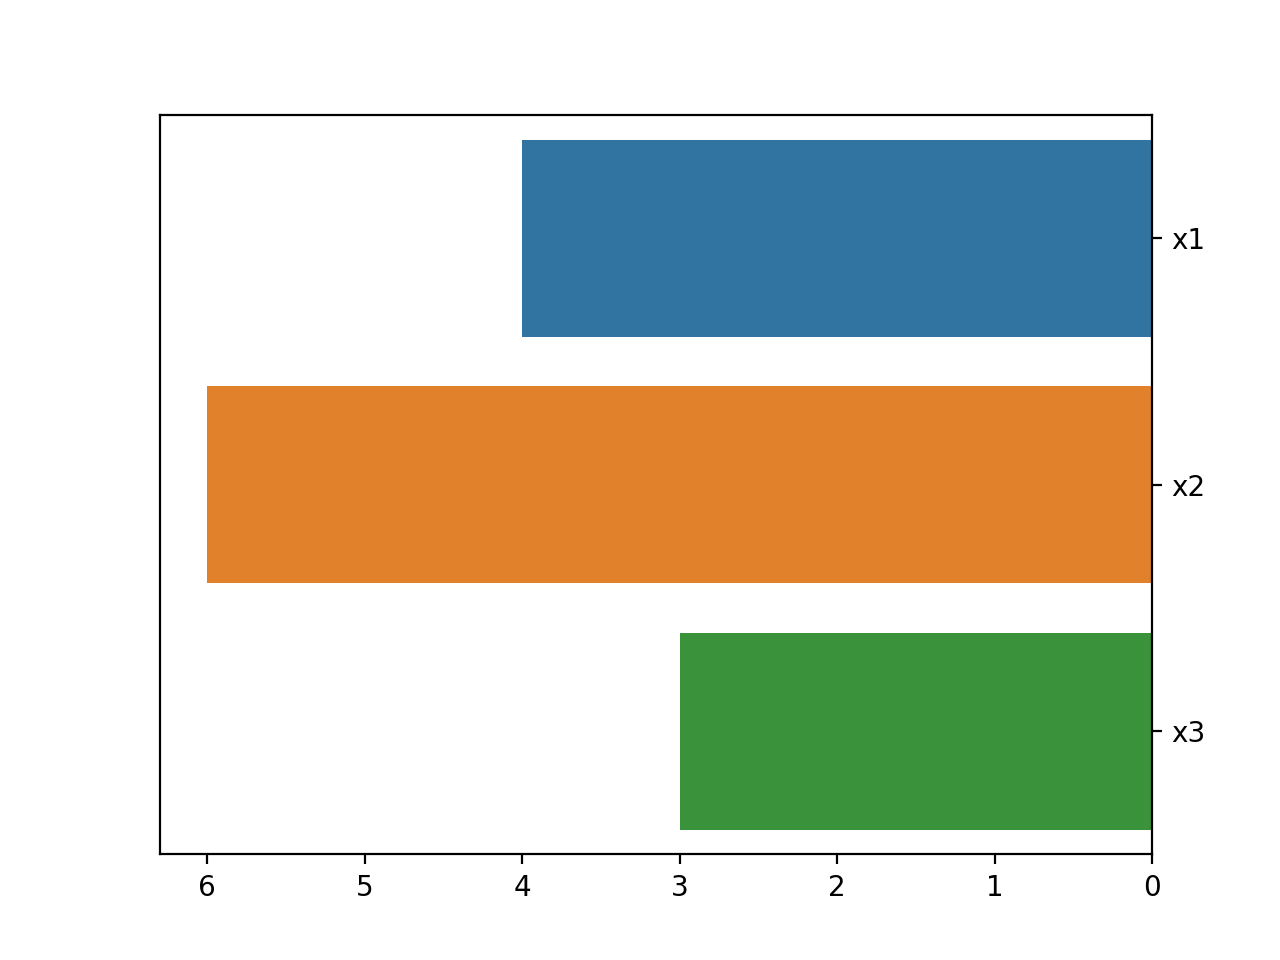
在那个例子中,我抓住了现有的限制,只是扭转了它们。或者,您只需显式地设置它们,确保第一个数字是上限,以确保反比例尺。例如:
ax.set_xlim(6.5, 0)最后一种选择是使用内置的ax.invert_xaxis()函数
页面原文内容由Stack Overflow提供。腾讯云小微IT领域专用引擎提供翻译支持
原文链接:
https://stackoverflow.com/questions/68858330
复制相关文章
相似问题
腾讯云开发者

Copyright © 2013 - 2026 Tencent Cloud. All Rights Reserved. 腾讯云 版权所有
深圳市腾讯计算机系统有限公司 ICP备案/许可证号:粤B2-20090059  粤公网安备44030502008569号
腾讯云计算(北京)有限责任公司 京ICP证150476号 | 京ICP备11018762号