
用drm函数在一幅图上绘制几条拟合曲线
用drm函数在一幅图上绘制几条拟合曲线
提问于 2021-08-09 08:25:07
我试图绘制一些数据,这些数据与R中的drc软件包中的drm()函数相匹配,我希望在同一图中有几条曲线相互重叠。
我可以得到一条拟合的曲线,其余的就像这样变成一条曲线:
#This is only mock data to show the concept

library(drc)

CurveData1 <- c(1, 1.1, 1.2, 1.3,2,3,4,5,5.2,5.4, 5.5, 5.6)
CurveData2 <- c(2, 2.1, 2.2, 2.3,3,4,5,6,6.2,6.4, 6.5, 6.6)
CurveData3 <- c(3, 3.1, 3.2, 3.3,4,5,6,7,7.2,7.4, 7.5, 7.6)
Conc <- c(1, 2, 3, 4, 5, 6, 7, 8, 9, 10, 11, 12)

fit1 <- drm(CurveData1 ~ Conc, fct = LL.5())


plot(fit1, col = "black")
lines(CurveData2, Conc, col = "orange", type = "b")
lines(CurveData3, Conc, col = "blue", type = "b")
然而,当我试图将所有拟合的曲线放到同一个图中时,如下所示:
#This is only mock data to show the concept

library(drc)

CurveData1 <- c(1, 1.1, 1.2, 1.3,2,3,4,5,5.2,5.4, 5.5, 5.6)
CurveData2 <- c(2, 2.1, 2.2, 2.3,3,4,5,6,6.2,6.4, 6.5, 6.6)
CurveData3 <- c(3, 3.1, 3.2, 3.3,4,5,6,7,7.2,7.4, 7.5, 7.6)
Conc <- c(1, 2, 3, 4, 5, 6, 7, 8, 9, 10, 11, 12)

fit1 <- drm(CurveData1 ~ Conc, fct = LL.5())
fit2 <- drm(CurveData2 ~ Conc, fct = LL.5())
fit3 <- drm(CurveData3 ~ Conc, fct = LL.5())

plot(fit1, col = "black")
lines(fit2, col = "orange", type = "b")
lines(fit3, col = "blue", type = "b")
我收到以下错误消息:
xy.coords(x,y)中的错误:'x‘是一个列表,但没有组件'x’和'y‘
知道为什么会发生这样的事吗?如何绕过它?这是由于lines()函数还是plot()函数中的限制造成的?
回答 1
Stack Overflow用户
回答已采纳
发布于 2021-08-09 10:06:07
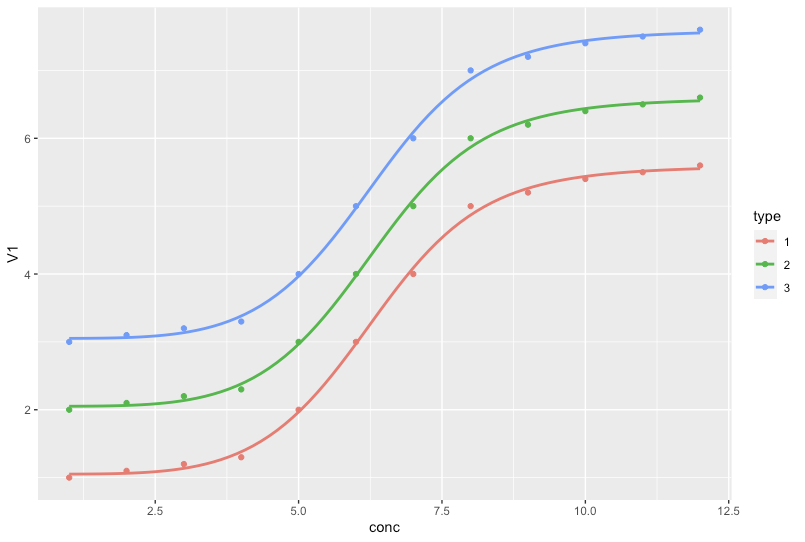
这就是诀窍吗?
library(drc)
library(ggplot2)
CurveData1 <- as.data.frame(as.matrix(c(1, 1.1, 1.2, 1.3,2,3,4,5,5.2,5.4, 5.5, 5.6)))
CurveData2 <- as.data.frame(as.matrix(c(2, 2.1, 2.2, 2.3,3,4,5,6,6.2,6.4, 6.5, 6.6)))
CurveData3 <- as.data.frame(as.matrix(c(3, 3.1, 3.2, 3.3,4,5,6,7,7.2,7.4, 7.5, 7.6)))
CurveData1$type = '1'
CurveData2$type = '2'
CurveData3$type = '3'
Conc <- c(1, 2, 3, 4, 5, 6, 7, 8, 9, 10, 11, 12)
all = rbind(CurveData1,CurveData2,CurveData3)
all$conc = rep(Conc,3)

ggplot(all, aes(x = conc, y = V1, col = type))+
  geom_point()+
  geom_smooth(method = drm, method.args = list(fct = LL.5()), se = FALSE)
结果:
页面原文内容由Stack Overflow提供。腾讯云小微IT领域专用引擎提供翻译支持
原文链接:
https://stackoverflow.com/questions/68708954
复制相关文章
相似问题
腾讯云开发者

Copyright © 2013 - 2026 Tencent Cloud. All Rights Reserved. 腾讯云 版权所有
深圳市腾讯计算机系统有限公司 ICP备案/许可证号:粤B2-20090059 ![]() 粤公网安备44030502008569号
粤公网安备44030502008569号
腾讯云计算(北京)有限责任公司 京ICP证150476号 | 京ICP备11018762号