
如何使用gganimate、sf和ggplot2在空间地图上绘制点?
如何使用gganimate、sf和ggplot2在空间地图上绘制点?
提问于 2021-07-20 06:52:41
我在绘制空间地图上的一些点时遇到了一些麻烦。由于某种原因,只有大约一半的积分出现在动画中。在静态图中,我可以清楚地看到所有的要点。
如何确保gganimation显示所有要点?gganimate不对空间地图“玩得好”吗?
有没有人有更多的使用gganimate和空间绘图的经验?我可以用一个示例数据集再现这个问题:
    library(sf)
    library(ggplot2)
    library(ggspatial)
    library(gganimate)

##Reading example data
    nc <- st_read(system.file("shape/nc.shp", package="sf"))

##Create new sf=variable of random points
    A <- nc %>%
      st_sample(size = 30) %>%
      st_coordinates() %>%
      as.data.frame()

##Create static map
    B <- ggplot() +
      annotation_spatial(data=nc) +
      geom_point(data = A, aes(x=X, y=Y), size = 2, col = "#3a6589")

##Create animation with points showing up one by one
    plot_anim <- B +
      transition_states(states = Y, state_length = 0, wrap = FALSE) +
      enter_recolor(fill = "#f0f5f9") +
      shadow_mark(past = TRUE, alpha = 1, fill = "#3a6589")

##Render animation
animate(plot_anim, fps = 40, end_pause = 60)回答 1
Stack Overflow用户
回答已采纳
发布于 2021-07-20 08:36:20
我建议通过ggplot2::geom_sf()绘制你的观点-我发现它在动画空间数据中是可靠的。
请参阅下面略为修改的代码;我所做的是:
- 保持A对象的
sf格式 - 创建具有第二个(= Y)坐标的技术变量Y;然后将其用于原始代码中
- 移除ggspatial依赖项,并重新构造静态映射调用。
- 删除fps = 40 (这除了文件大小外没有任何影响);我们需要不到2MB才能在这里上传。
您可能会发现您需要安装{transformr}来动画sf对象;它不应该是一个显示停止。
library(sf)
library(ggplot2)
library(gganimate)
##Reading example data
nc <- st_read(system.file("shape/nc.shp", package="sf"))
##Create new sf=variable of random points
A <- nc %>%
st_sample(size = 30) %>%
st_as_sf() %>%
dplyr::mutate(Y = st_coordinates(.)[,2])
##Create static map
B <- ggplot() +
geom_sf(data = nc) +
geom_sf(data = A, size = 2, col = "#3a6589")
# save static map
ggsave("static_map.png")
##Create animation with points showing up one by one
plot_anim <- B +
transition_states(states = Y, state_length = 0, wrap = FALSE) +
enter_recolor(fill = "#f0f5f9") +
shadow_mark(past = TRUE, alpha = 1, fill = "#3a6589")
##Render animation
animate(plot_anim, end_pause = 60,
height = 200, width = 400) # a higher res img would not upload here :(
# save animated map
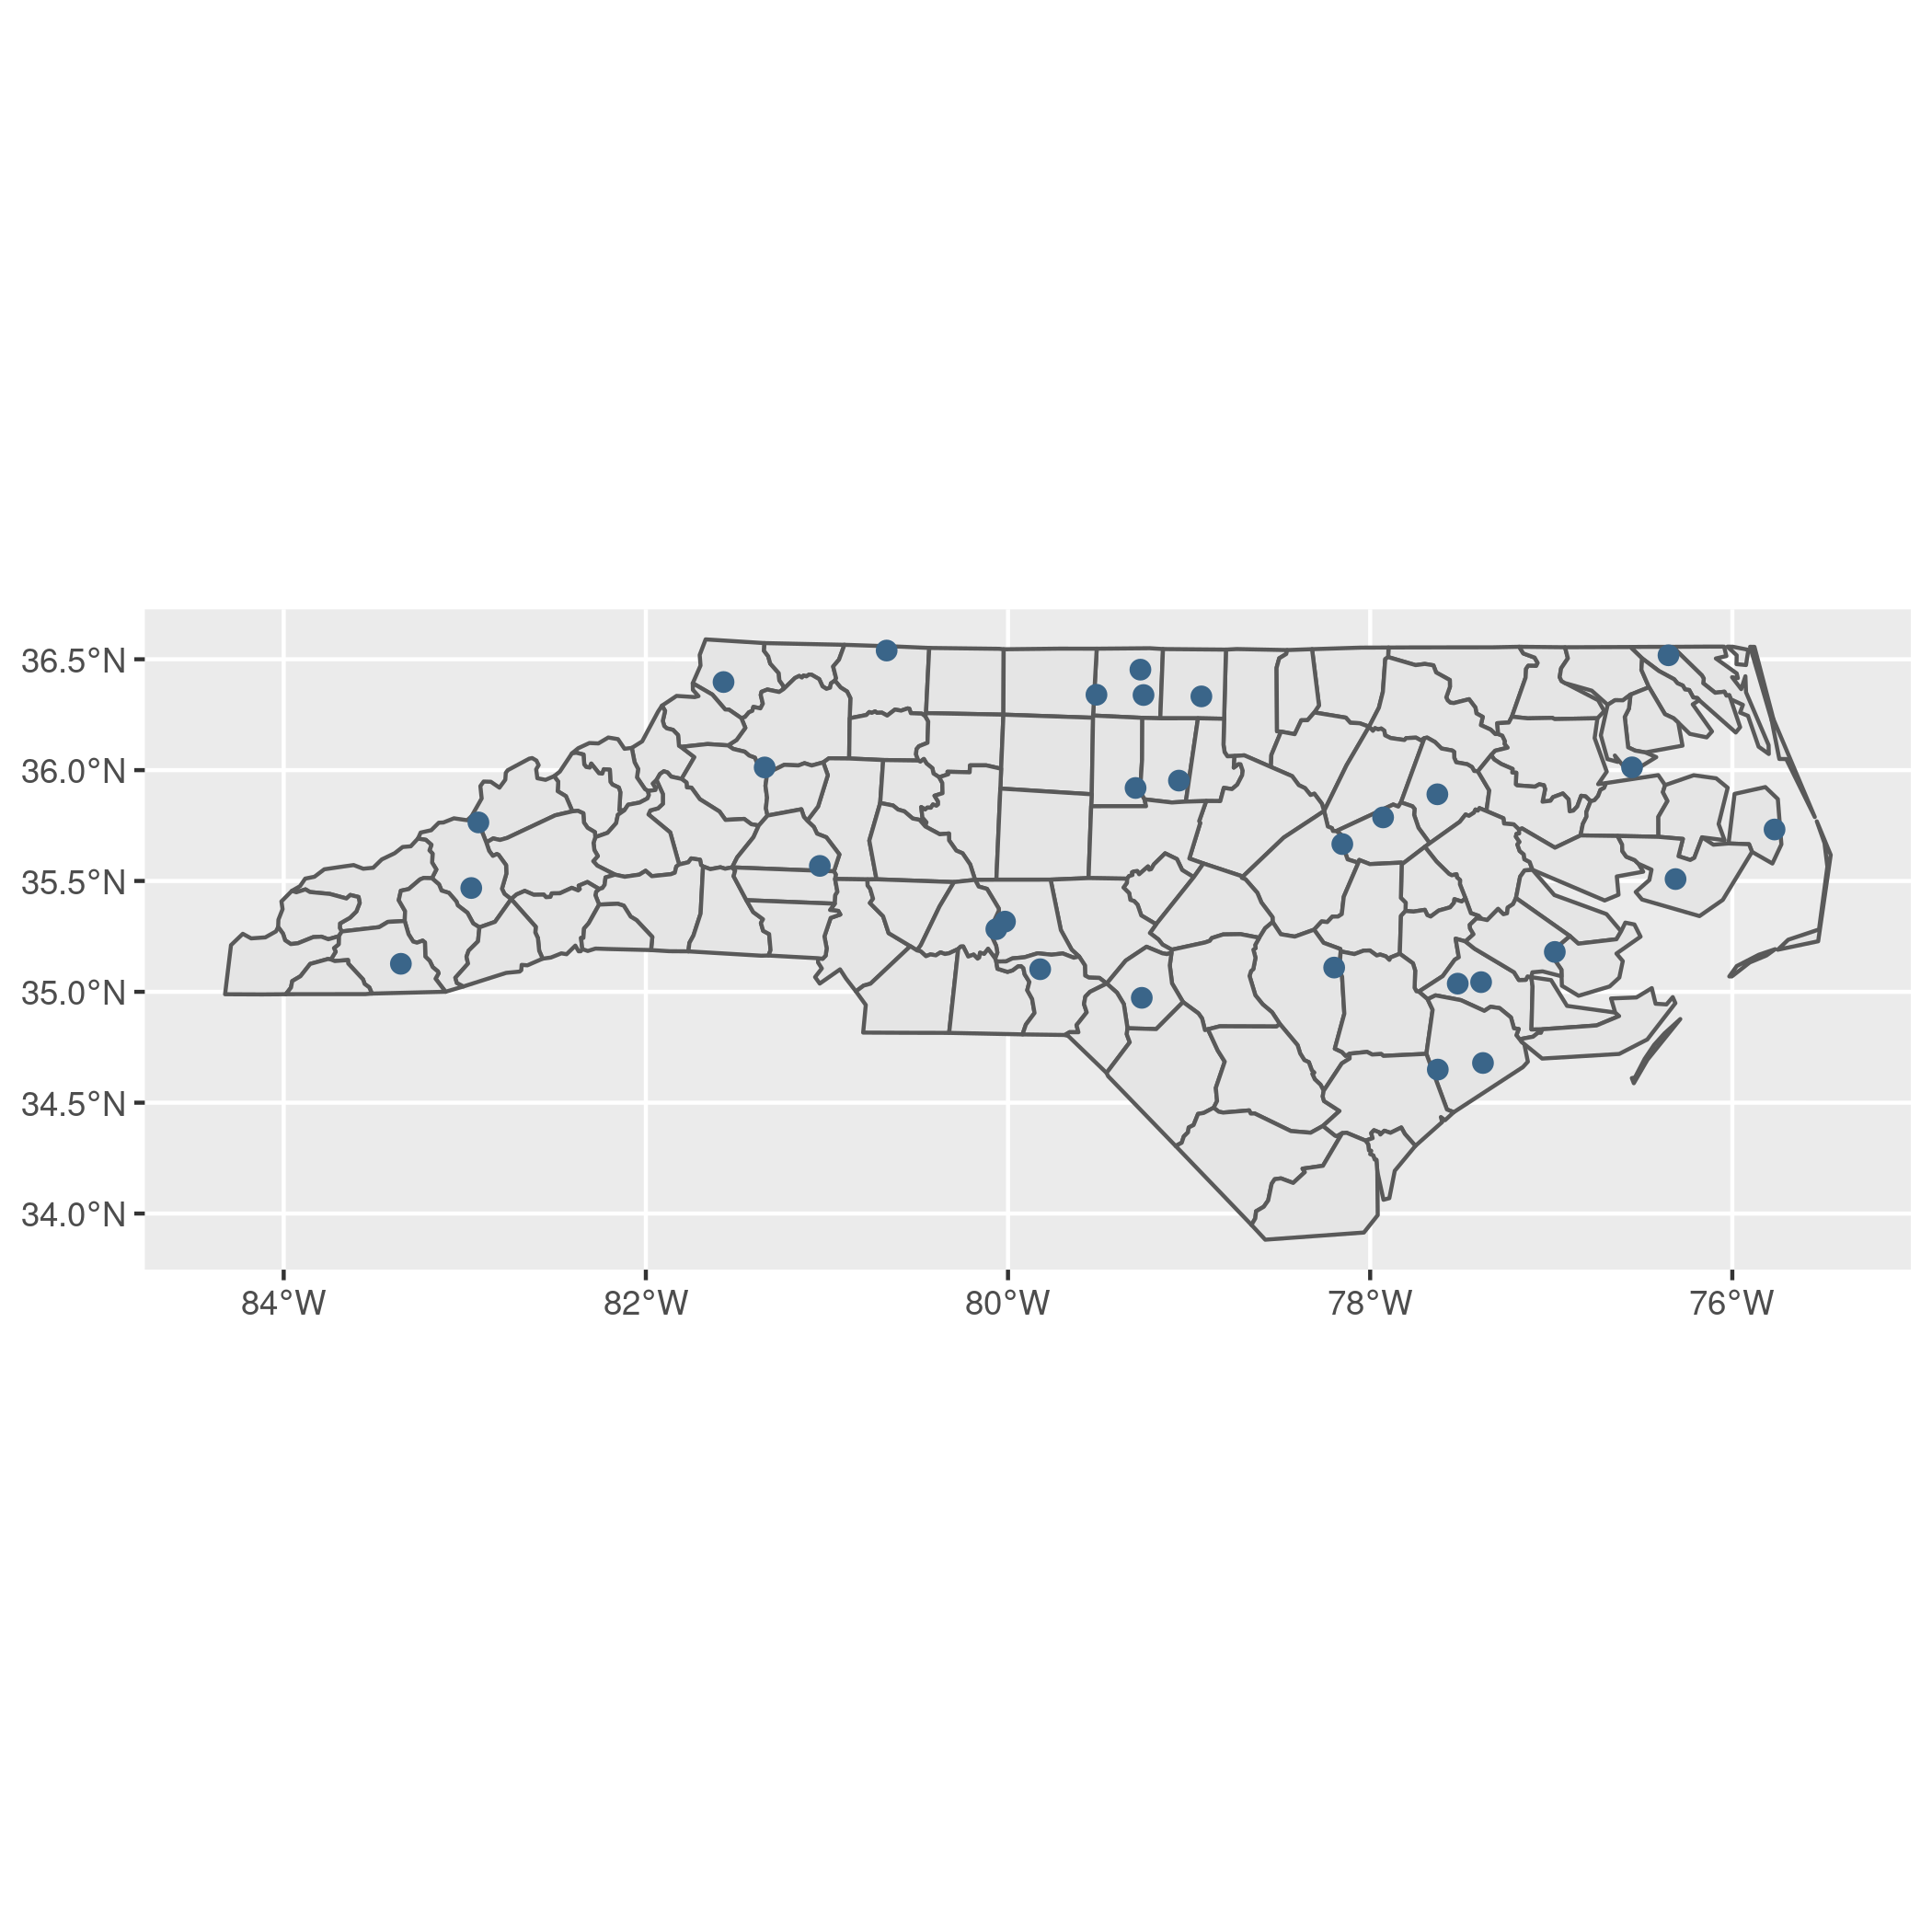
anim_save("animated_map.gif")静态映射/30个随机数控点
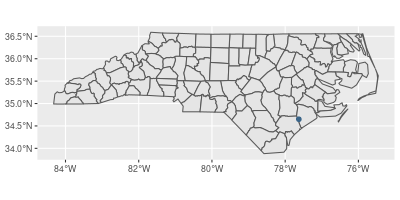
动态地图/小(因为2MB的上传要求),但在我看来是合法的.
页面原文内容由Stack Overflow提供。腾讯云小微IT领域专用引擎提供翻译支持
原文链接:
https://stackoverflow.com/questions/68450668
复制相关文章
相似问题
腾讯云开发者

Copyright © 2013 - 2026 Tencent Cloud. All Rights Reserved. 腾讯云 版权所有
深圳市腾讯计算机系统有限公司 ICP备案/许可证号:粤B2-20090059 ![]() 粤公网安备44030502008569号
粤公网安备44030502008569号
腾讯云计算(北京)有限责任公司 京ICP证150476号 | 京ICP备11018762号