
用ggplot绘制drc
用ggplot绘制drc
提问于 2021-07-01 12:15:03
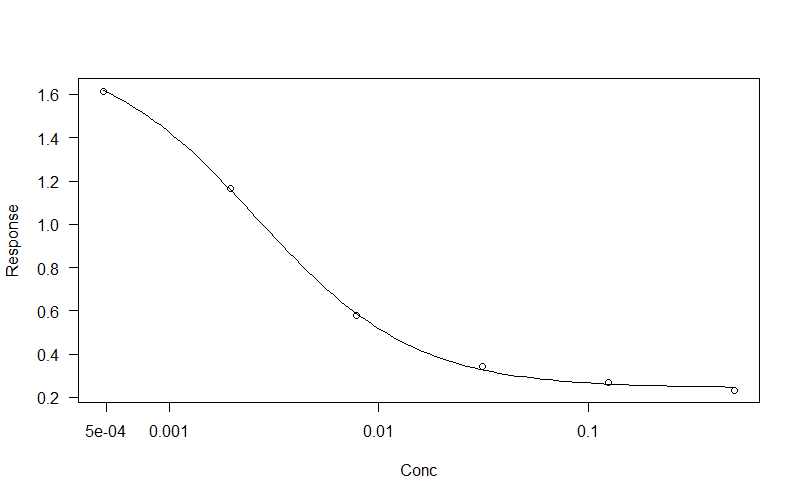
我想用ggplot绘制剂量反应曲线,但当我这样做时,它看起来非常不同。是否可以用ggplot绘制曲线,因为它在使用基数R的plot函数进行轮询时看上去准确?
关于drm model摘要的第二个问题:哪个参数更能反映绑定: b、c、d或e?
library(drm)
library(ggplot2)
test_data <- data.frame(Conc = c(0.0004882812, 0.001953125 ,0.0078125, 0.03125 ,0.125 ,0.5),
Response = c(1.616017 ,1.165835, 0.5783709, 0.3440007, 0.2668585, 0.2336709))
## plot drm model
model_drm <- drm(Response ~ Conc, data=test_data,
fct=LL.4())
summary(model_drm)
plot(model_drm)
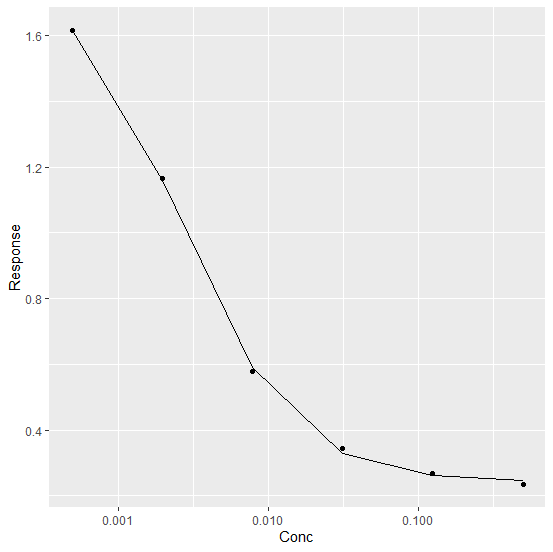
## now using ggplot
ggplot(test_data, aes(x = Conc, y = Response )) +
geom_point() +
stat_smooth(method = "drm",
method.args = list(
fct = LL.4()),se = FALSE)
Model fitted: Log-logistic (ED50 as parameter) (4 parms)

Parameter estimates:

                Estimate Std. Error t-value  p-value
b:(Intercept) 1.15894518 0.08339821  13.896 0.005138 **
c:(Intercept) 0.24398009 0.01385086  17.615 0.003207 **
d:(Intercept) 1.81356338 0.05324814  34.059 0.000861 ***
e:(Intercept) 0.00261968 0.00020635  12.695 0.006148 **
---
Signif. codes:
0 ‘***’ 0.001 ‘**’ 0.01 ‘*’ 0.05 ‘.’ 0.1 ‘ ’ 1

Residual standard error:
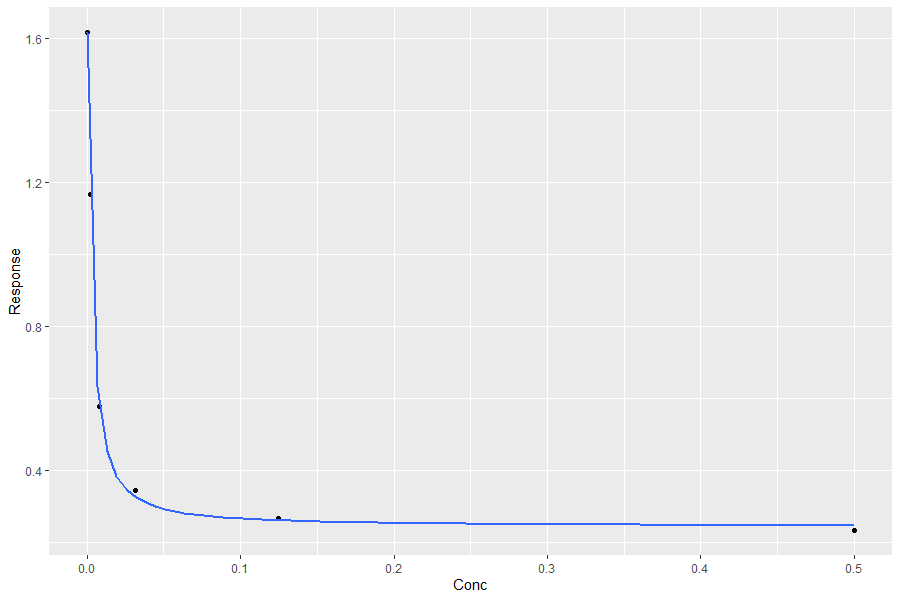
0.01758151 (2 degrees of freedom)编辑:添加日志转换将导致不再绘制曲线:
ggplot(test_data, aes(x = Conc, y = Response )) +
  geom_point() +
  stat_smooth(
              method = "drm",
              method.args = list(
                fct = LL.4()
              ),
              se = FALSE
  )+
  scale_x_continuous(trans="log10")
回答 2
Stack Overflow用户
发布于 2021-07-01 13:08:17
X轴需要log10缩放。此外,我们还可以重复使用已经完成的模型的计算。
ggplot(cbind(test_data, fit = fitted(model_drm)), aes(x = Conc, y = Response )) +
   geom_point() +
   geom_line(aes(y = fit)) +
   scale_x_continuous(trans = "log10")
Stack Overflow用户
发布于 2021-07-01 13:53:04
ggplot(test_data, aes(x = Conc, y = Response )) +
  geom_point() +
  geom_line(aes(y = predict(model_drm))) +
scale_x_log10()页面原文内容由Stack Overflow提供。腾讯云小微IT领域专用引擎提供翻译支持
原文链接:
https://stackoverflow.com/questions/68209998
复制相关文章
相似问题
腾讯云开发者

Copyright © 2013 - 2026 Tencent Cloud. All Rights Reserved. 腾讯云 版权所有
深圳市腾讯计算机系统有限公司 ICP备案/许可证号:粤B2-20090059 ![]() 粤公网安备44030502008569号
粤公网安备44030502008569号
腾讯云计算(北京)有限责任公司 京ICP证150476号 | 京ICP备11018762号