
如何在python中0点之间的时间序列数据中找到最高峰值?
我试图获取我的时间序列数据,并将所有数据隔离到0之间,然后识别出具有最高峰值的时间间隔。我在蟒蛇工作。
引用此图:具有峰和谷的时间序列数据
来源:https://tcoil.info/find-peaks-and-valleys-in-dataset-with-python/
注意到第一个也是最后一个红谷点在0,我想找到一种方法来获取时间序列数据,识别y轴上的所有点,然后在两者之间隔离数据。对于我链接到这里的图,我希望在第一个和最后一个红谷点之间隔离所有数据。我想要在整个时间序列数据集中这样做,其中y轴上0点之间的数据是孤立的。既然这些间隔是独立的(代表整个数据的不同事件/周期),我想记录每个间隔中的最高点。然后,我想找出有5个最高峰的间隔(每个间隔有一个峰值)。最后,我希望输出包含这些前5个峰值的间隔(或范围)。对于上下文,每一个间隔都代表一个事件/周期,我想找到最极端的。因此,我想要一个输出,从本质上告诉我,最极端的事件/周期发生在3/5/20和3/24/20之间。
如何在python中做到这一点?我需要先整理一下数据吗?如何隔离y轴上0点之间的数据?我正在试图找出哪个方向进入第一,但还没有代码。
回答 1
Stack Overflow用户
发布于 2021-05-19 02:26:23
让我们使用您引用的数据。我将添加详细的解释作为评论。
x = np.linspace(-1, 3, 1000)
y = -0.1 * np.cos(12*x) + np.exp(-(1-x)**2)
我想找到一种获取时间序列数据的方法,识别y轴上所有的0点,然后在y轴之间隔离数据。
基本上,你想把y轴上的连续点和y轴下面的点分开。基于这个答案,您可以这样做:
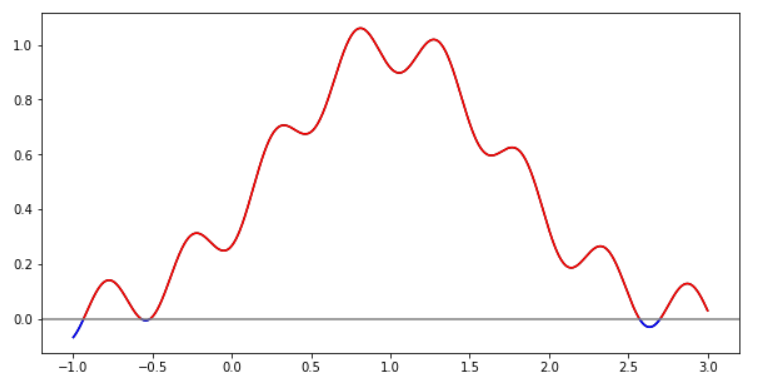
fig, ax = plt.subplots(figsize=(10, 5))
ax.plot(x, y, color='black')

# Find all consecutive chunks that are above y=0
for start, stop in contiguous_regions(y > 0):
    ax.plot(x[start:stop], y[start:stop], color='red')

# Find all consecutive chunks that are below y=0
for start, stop in contiguous_regions(y < 0):
    ax.plot(x[start:stop], y[start:stop], color='blue')

ax.axhline(0, color='grey')
plt.show()
plt.close()
蓝色点在y轴下方,红色点在上面,如你所见。他们肯定是孤立的。
对于我链接到这里的图,我希望在第一个和最后一个红谷点之间隔离所有数据。
你也可以这么做。对于每一块,我们将需要找到它的山谷,你可以这样做,看看你发送给我们的链接!
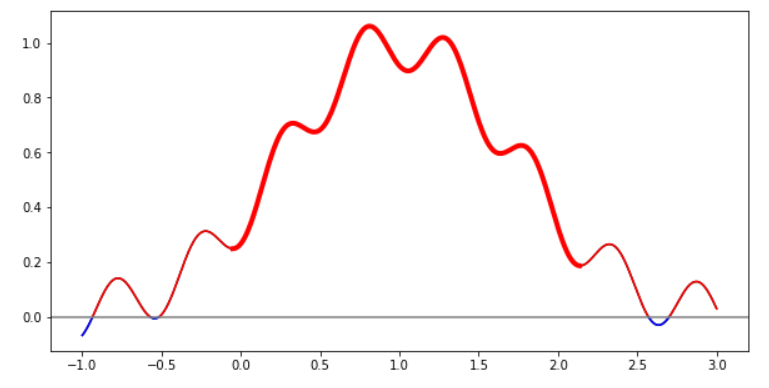
fig, ax = plt.subplots(figsize=(10, 5))
ax.plot(x, y, color='black')
for start, stop in contiguous_regions(y > 0):
    x_chunk, y_chunk = x[start:stop], y[start:stop]
    ax.plot(x_chunk, y_chunk, color='red')

    # Find all the valleys
    valleys = (np.diff(np.sign(np.diff(y_chunk))) > 0).nonzero()[0] + 1

    # If there's more than two valleys (the first and the last)
    if valleys.size > 2:
        # Get'em!
        iv0, *_, iv1 = valleys

        # Plot'em!
        ax.plot(x_chunk[iv0:iv1], y_chunk[iv0:iv1], color='red', linewidth=4)

for start, stop in contiguous_regions(y < 0):
    x_chunk, y_chunk = x[start:stop], y[start:stop]
    ax.plot(x_chunk, y_chunk, color='blue')

    # The same.
    valleys = (np.diff(np.sign(np.diff(y_chunk))) > 0).nonzero()[0] + 1
    if valleys.size > 2:
        iv0, *_, iv1 = valleys
        ax.plot(x_chunk[iv0:iv1], y_chunk[iv0:iv1], color='blue', linewidth=4)

ax.axhline(0, color='grey')
plt.show()
plt.close()
看到那条大红线了吗?这是我们的,没错。
我们在这里开始重复了。让我们来做一个函数:
def do_chunk(x_chunk, y_chunk, color):
    ax.plot(x_chunk, y_chunk, color=color)

    valleys = (np.diff(np.sign(np.diff(y_chunk))) > 0).nonzero()[0] + 1
    if valleys.size > 2:
        iv0, *_, iv1 = valleys
        ax.plot(x_chunk[iv0:iv1], y_chunk[iv0:iv1], color=color, linewidth=4)

fig, ax = plt.subplots(figsize=(10, 5))
ax.plot(x, y, color='black')
for start, stop in contiguous_regions(y > 0):
    do_chunk(x[start:stop], y[start:stop], 'red')

for start, stop in contiguous_regions(y < 0):
    do_chunk(x[start:stop], y[start:stop], 'blue')

ax.axhline(0, color='grey')
plt.show()
plt.close()
这更好,甚至更好:用同样的情节。下一步是什么?
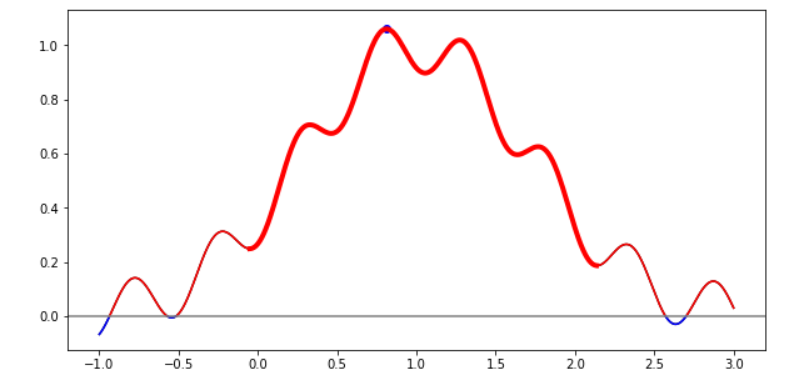
既然这些间隔是独立的(代表整个数据的不同事件/周期),我想记录每个间隔中的最高点。
但那太容易了。让我们像裘德一样,可能是谁来了。
def do_chunk(x_chunk, y_chunk, color):
    ax.plot(x_chunk, y_chunk, color=color)

    valleys = (np.diff(np.sign(np.diff(y_chunk))) > 0).nonzero()[0] + 1
    if valleys.size > 2:
        iv0, *_, iv1 = valleys
        x_trim, y_trim = x_chunk[iv0:iv1], y_chunk[iv0:iv1]
        ax.plot(x_trim, y_trim, color=color, linewidth=4)

        # Get the index of the maximum value in this trim
        ip = np.argmax(y_trim)
        ax.scatter(x_trim[ip], y_trim[ip], color='blue')

fig, ax = plt.subplots(figsize=(10, 5))
ax.plot(x, y, color='black')
for start, stop in contiguous_regions(y > 0):
    do_chunk(x[start:stop], y[start:stop], 'red')

for start, stop in contiguous_regions(y < 0):
    do_chunk(x[start:stop], y[start:stop], 'blue')

ax.axhline(0, color='grey')
plt.show()
plt.close()
你看到那边那个小点了吗?也是我们的。最高峰。
然后,我想找出有5个最高峰的间隔(每个间隔有一个峰值)。
好吧,这是一个更难的。让我们创建一些列表,以便存储它们!
def do_chunk(x_chunk, y_chunk, color):
    ax.plot(x_chunk, y_chunk, color=color)

    valleys = (np.diff(np.sign(np.diff(y_chunk))) > 0).nonzero()[0] + 1
    if valleys.size > 2:
        iv0, *_, iv1 = valleys
        x_trim, y_trim = x_chunk[iv0:iv1], y_chunk[iv0:iv1]
        ax.plot(x_trim, y_trim, color=color, linewidth=4)

        ip = np.argmax(y_trim)
        ax.scatter(x_trim[ip], y_trim[ip], color='blue')

        # Return the x, y of the peak
        return x_trim[ip], y_trim[ip]

    return None

fig, ax = plt.subplots(figsize=(10, 5))
ax.plot(x, y, color='black')

intervals = []

for start, stop in contiguous_regions(y > 0):
    # Receive it here
    peak = do_chunk(x[start:stop], y[start:stop], 'red')

    # If this data contains at least two valleys
    if peak is not None:
        # Let's use a Javascript favorite to store data: JSONs
        intervals.append({
            'start': start,
            'stop': stop,
            'peak': peak,
        })

for start, stop in contiguous_regions(y < 0):
    peak = do_chunk(x[start:stop], y[start:stop], 'blue')
    if peak is not None:
        intervals.append({
            'start': start,
            'stop': stop,
            'peak': peak,
        })

ax.axhline(0, color='grey')
plt.show()
plt.close()那么,intervals里面是什么呢?我们去看看!哦,我查过了。它给了我
[{'start': 121, 'stop': 892, 'peak': (0.8098098098098099, 1.0602140027371494)}]这到底是什么意思?这意味着,从索引121到索引892,最高的峰值出现在x=0.809和y=1.060。太好了,哈?因为所使用的数据只有一个峰值,那就是他。
要找到最高的y峰,只需做一个列表理解:
# High five!
high_five = sorted(  # Sort it, so the highest peaks will be on the list tail
    [(interval["start"], interval["stop"]) for interval in intervals],
    key=lambda interval: interval["peak"][1], # Filter by the y-value of its peak
)[:-5]  # Get the last five
最后,我希望输出包含这些前5个峰值的间隔(或范围)。
现在很简单,但我会把这个留给你。相信我,最糟糕的部分已经结束了。
https://stackoverflow.com/questions/67595569
复制相似问题
腾讯云开发者

Copyright © 2013 - 2026 Tencent Cloud. All Rights Reserved. 腾讯云 版权所有
深圳市腾讯计算机系统有限公司 ICP备案/许可证号:粤B2-20090059 ![]() 粤公网安备44030502008569号
粤公网安备44030502008569号
腾讯云计算(北京)有限责任公司 京ICP证150476号 | 京ICP备11018762号