
在r中创建制图图时的问题
在r中创建制图图时的问题
提问于 2021-05-17 13:35:18
我对Spatial data & cartogram库很陌生,在尝试从:https://www.r-graph-gallery.com/a-smooth-transition-between-chloropleth-and-cartogram.html重新创建情节时遇到了一些问题。
Lib & Data
library(tidyverse)
library(maptools)
library(cartogram)
library(viridis)
library(sf)

data("wrld_simpl")

afr_cartogram = wrld_simpl[wrld_simpl$REGION==2,]在此之后,我遇到了一些错误:比如st_transform .在使用sf lib进行googling搜索之后,我修复了它。
afr_sf <- st_as_sf(afr_cartogram)

afr_sf_proj = st_transform(afr_sf,3857)

afr_plot <- cartogram::cartogram(afr_sf_proj, "POP2005", itermax =7)
问题:在这一步之后,现在无法重新创建代码,就像在演示网站中一样,因为I在数据中没有列。
ggplot() +
  geom_polygon(data = afr_plot, aes(fill = POP2005/1000000, x = LON, y = LAT, group = group) , size=0, alpha=0.9) +
theme_void()从哪里可以得到group列?
网站使用的代码:
data(wrld_simpl)
afr=wrld_simpl[wrld_simpl$REGION==2,]
afr_cartogram <- cartogram(afr, "POP2005", itermax=7)
# Transform these 2 objects in dataframe, plotable with ggplot2
afr_cartogram_df <- tidy(afr_cartogram) %>% left_join(. , afr_cartogram@data, by=c("id"="ISO3"))
afr_df <- tidy(afr) %>% left_join(. , afr@data, by=c("id"="ISO3"))
# And using the advices of chart #331 we can custom it to get a better result:
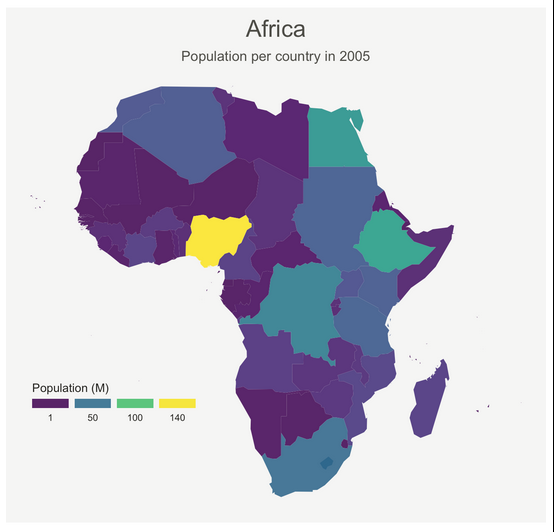
ggplot() +
geom_polygon(data = afr_df, aes(fill = POP2005/1000000, x = long, y = lat, group = group) , size=0, alpha=0.9) +
theme_void() +
scale_fill_viridis(name="Population (M)", breaks=c(1,50,100, 140), guide = guide_legend( keyheight = unit(3, units = "mm"), keywidth=unit(12, units = "mm"), label.position = "bottom", title.position = 'top', nrow=1)) +
labs( title = "Africa", subtitle="Population per country in 2005" ) +
ylim(-35,35) +
theme(
text = element_text(color = "#22211d"),
plot.background = element_rect(fill = "#f5f5f4", color = NA),
panel.background = element_rect(fill = "#f5f5f4", color = NA),
legend.background = element_rect(fill = "#f5f5f4", color = NA),
plot.title = element_text(size= 22, hjust=0.5, color = "#4e4d47", margin = margin(b = -0.1, t = 0.4, l = 2, unit = "cm")),
plot.subtitle = element_text(size= 13, hjust=0.5, color = "#4e4d47", margin = margin(b = -0.1, t = 0.4, l = 2, unit = "cm")),
legend.position = c(0.2, 0.26)
) +
coord_map()回答 1
Stack Overflow用户
回答已采纳
发布于 2021-05-17 13:53:53
在这些行中生成group列
afr_cartogram_df <- tidy(afr_cartogram) %>%
   left_join(afr_cartogram@data, by = ("id" = "ISO3"))
afr_df <- tidy(afr) %>%
left_join(afr@data, by = c("id" = "ISO3"))由没有附加在您的代码中的包tidy函数broom!
使用library(broom)附加library(broom)或从其名称空间调用tidy(),如:broom::tidy(...)。
代码中的“数据”部分应该如下所示:
data(wrld_simpl)
afr <- wrld_simpl[wrld_simpl$REGION==2, ]
afr_cartogram <- wrld_simpl[wrld_simpl$REGION == 2,]
afr_sf <- st_as_sf(afr_cartogram)
afr_sf_proj <- st_transform(afr_sf,  3857)
afr_plot <- cartogram_cont(afr_sf_proj, "POP2005", itermax =7)

afr_cartogram_df <- broom::tidy(afr_cartogram) %>%
  left_join(afr_cartogram@data, by=c("id" = "ISO3"))
afr_df <- broom::tidy(afr) %>%
left_join(afr@data, by=c("id" = "ISO3")) 随后的ggplot代码运行良好:
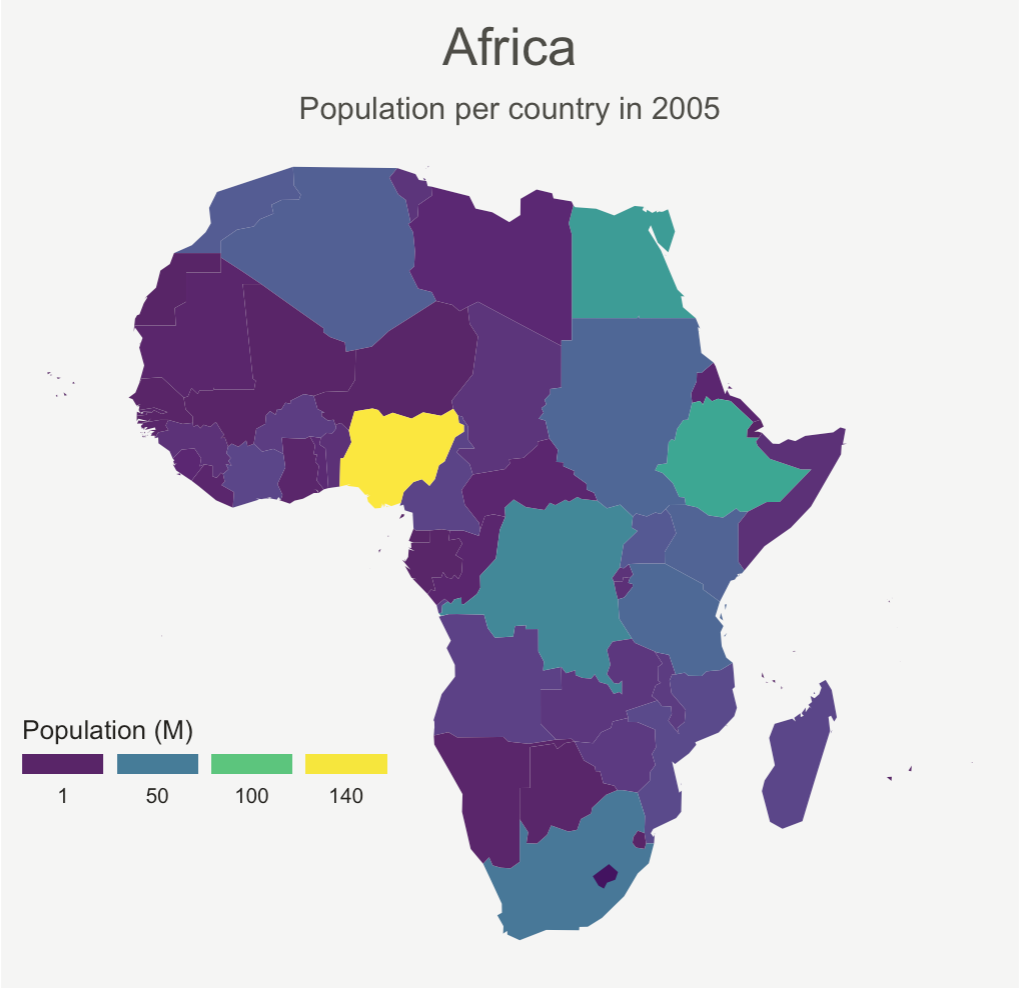
页面原文内容由Stack Overflow提供。腾讯云小微IT领域专用引擎提供翻译支持
原文链接:
https://stackoverflow.com/questions/67570783
复制相关文章
相似问题
腾讯云开发者

Copyright © 2013 - 2026 Tencent Cloud. All Rights Reserved. 腾讯云 版权所有
深圳市腾讯计算机系统有限公司 ICP备案/许可证号:粤B2-20090059 ![]() 粤公网安备44030502008569号
粤公网安备44030502008569号
腾讯云计算(北京)有限责任公司 京ICP证150476号 | 京ICP备11018762号