
使用TPOT分级机的形状或石灰
使用TPOT分级机的形状或石灰
提问于 2021-05-05 02:54:01
如何在TPOT导出管道中使用shap或lime或任何其他模型可解释工具?例如,以下是shap库的一些代码,但您不能将TPOT管道传递给它。你会把什么东西放进去?
explainer = shap.Explainer(model)
shap_values = explainer(X)回答 1
Stack Overflow用户
发布于 2021-12-17 02:12:32
解决方案1:
要使用SHAP解释scikit学习管道( TPOT优化过程的最终模型对象),需要指示SHAP使用管道最终估计器(分类器/回归器步骤),并且在将数据输入到SHAP解释程序之前,需要使用任何管道转换器步骤(即:预处理程序或特征选择器)来转换数据。
import numpy as np
import pandas as pd
import shap
from sklearn.datasets import load_iris
from tpot import TPOTClassifier
#Let's use the Iris dataset
iris = load_iris()
X = pd.DataFrame(iris.data, columns=iris.feature_names)
y = pd.DataFrame(iris.target)
tpot = TPOTClassifier(generations=3, population_size=25, verbosity=3, random_state=42)
tpot.fit(X, y)
#Inspect resulting Pipeline. Great, 2 steps in the Pipeline: one selector and then the classifier.
tpot.fitted_pipeline_
Pipeline(steps=[('variancethreshold', VarianceThreshold(threshold=0.05)),
('logisticregression',
LogisticRegression(C=10.0, random_state=42))])
# Before feeding your data to the explainer, you need to transform the data up to the Pipeline step before the classifier step.
# Beware that in this case it's just one step, but could be more.
shap_df = pd.DataFrame(tpot.fitted_pipeline_.named_steps["variancethreshold"].transform(X), columns=X.columns[tpot.fitted_pipeline_.named_steps["variancethreshold"].get_support(indices=True)])
# Finally, instruct the SHAP explainer to use the classifier step with the transformed data
shap.initjs()
explainer = shap.KernelExplainer(tpot.fitted_pipeline_.named_steps["logisticregression"].predict_proba, shap_df)
shap_values = explainer.shap_values(shap_df)
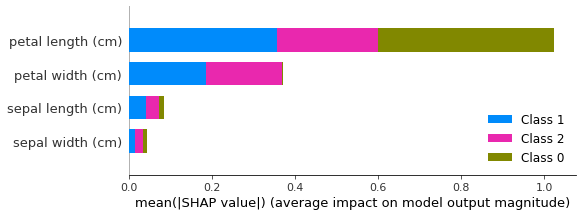
#Plot summary
shap.summary_plot(shap_values, shap_df)
解决方案2:
显然,科学工具-学习管道predict_proba()函数将完成刚才在解决方案1中描述的内容(即:转换数据,并将predict_proba与最终估计器一起应用。)
在这个意义上,这也适用于你:
import numpy as np
import pandas as pd
import shap
from sklearn.datasets import load_iris
from tpot import TPOTClassifier
iris = load_iris()
X = pd.DataFrame(iris.data, columns=iris.feature_names)
y = pd.DataFrame(iris.target)
tpot = TPOTClassifier(generations=10, population_size=50, verbosity=3, random_state=42, template='Selector-Transformer-Classifier')
tpot.fit(X, y)
#Resulting Pipeline
Pipeline(steps=[('variancethreshold', VarianceThreshold(threshold=0.0001)),
('rbfsampler', RBFSampler(gamma=0.8, random_state=42)),
('randomforestclassifier',
RandomForestClassifier(bootstrap=False, criterion='entropy',
max_features=0.5, min_samples_leaf=10,
min_samples_split=12,
random_state=42))])
explainer = shap.KernelExplainer(tpot.fitted_pipeline_.predict_proba, X)
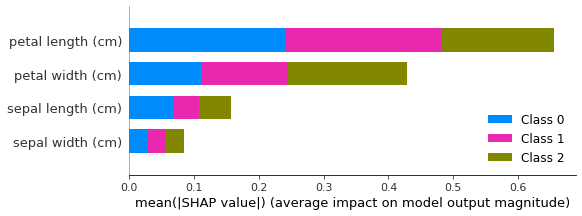
shap_values = explainer.shap_values(X)
shap.summary_plot(shap_values, X)
附加备注
如果使用基于树的模型,则可以使用TreeExplainer,它必须比一般的KernelExplainer更快。根据文档,支持LightGBM、CatBoost、Pyspark和大多数基于树的scikit学习模型。
页面原文内容由Stack Overflow提供。腾讯云小微IT领域专用引擎提供翻译支持
原文链接:
https://stackoverflow.com/questions/67394585
复制相关文章
相似问题
腾讯云开发者

Copyright © 2013 - 2026 Tencent Cloud. All Rights Reserved. 腾讯云 版权所有
深圳市腾讯计算机系统有限公司 ICP备案/许可证号:粤B2-20090059 ![]() 粤公网安备44030502008569号
粤公网安备44030502008569号
腾讯云计算(北京)有限责任公司 京ICP证150476号 | 京ICP备11018762号