
绘制UTM /坐标
绘制UTM /坐标
提问于 2021-03-27 01:53:12
我是R编程新手,我有一个csv/excel文件,其中包含了一个国家的20个城镇,其中包含以下格式,
城镇UTM协调UTM坐标
xxxxxxxx 1377777 249514
yyyyyyyy 142145 228942
我无法将它们绘制成地图,是否有人知道如何绘制这些UTM坐标。是否有可能用UTM在R编程中规划城镇?如果是的话有人能帮我一下吗。我也有这个国家的形状文件。但我不知道该怎么处理。
myfilepath <- file.choose()
Cordinates<-read.csv(myfilepath,header=TRUE)
Cordinates
str(Cordinates)
library(rgdal)
library(sp)
library(data.table)
library(ggplot2)
library(tibble)
myfilepath <- file.choose()
Shapefile<-readOGR(myfilepath)
plot(Shapefile)
ggmap(Shapefile)+geom_point(aes(x=Easting,y=Northing,col=Cordinates))
任何帮助都将不胜感激。
回答 2
Stack Overflow用户
回答已采纳
发布于 2021-03-27 11:37:02
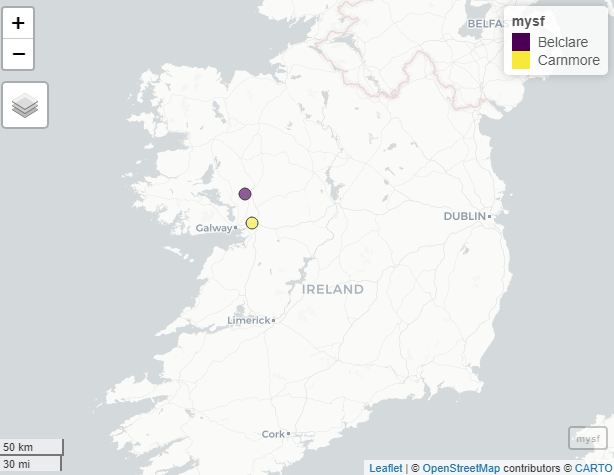
这是一个sf-solution,它利用@Dave2e中所有的辛勤工作来找到正确的坐标系统。
#convert to simple feature
library( sf )
mysf <- sf::st_as_sf( mydata, coords = c("Easting", "Northing"), crs = 29902)

#plot for visual inspection
mapview::mapview(mysf)
Stack Overflow用户
发布于 2021-03-27 04:36:28
诀窍是确定所使用的网格系统。经过多次搜索,标准爱尔兰共和国网格的代码是epsg:29902
第一步是将爱尔兰的网格坐标转换为标准的经纬度。这是通过"rgdal“库完成的。
library(rgdal)

points <- read.table(header=TRUE, text = "Towns Easting Northing
                      Belclare 137777 249514
                      Carnmore 142145 228942")

#Pull out the location columns and rename
point <- points[,2:3]
names(point) <-c('x', 'y')

#convert to corrdinates and define initial coordinates systems
coordinates(point) <- c('x', 'y')
proj4string(point)=CRS("+init=epsg:29902")  #29903 is the grid for Ireland

#Transform the Ireland's grid to longitude & latitude
coord<-spTransform(point,CRS("+init=epsg:4326"))
coord
这将转换您的坐标列表,请搜索该网站如何绘制成一张地图。有许多可供选择的方案。
页面原文内容由Stack Overflow提供。腾讯云小微IT领域专用引擎提供翻译支持
原文链接:
https://stackoverflow.com/questions/66827313
复制相关文章
相似问题
腾讯云开发者

Copyright © 2013 - 2026 Tencent Cloud. All Rights Reserved. 腾讯云 版权所有
深圳市腾讯计算机系统有限公司 ICP备案/许可证号:粤B2-20090059 ![]() 粤公网安备44030502008569号
粤公网安备44030502008569号
腾讯云计算(北京)有限责任公司 京ICP证150476号 | 京ICP备11018762号