
如何在igraph中图的各分量之间添加边
我有一个包含4 components的图表。现在,我想在all components中添加一个基于size of the membership的边缘。
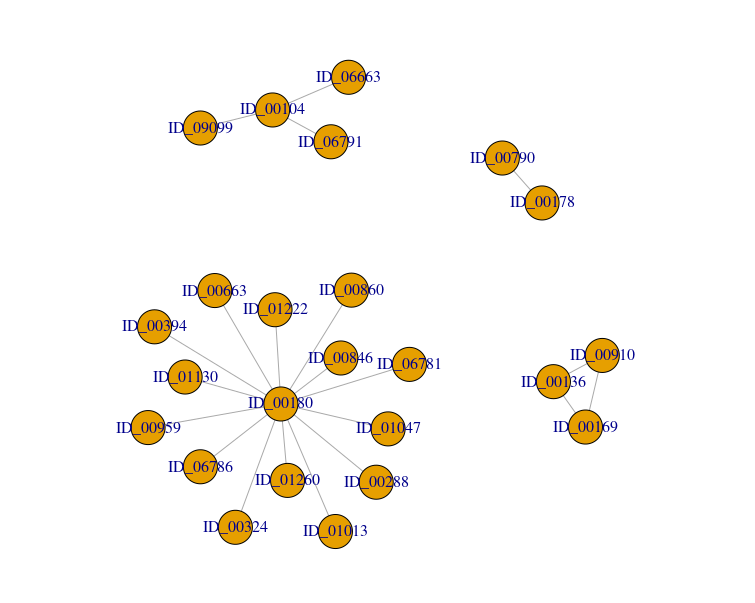
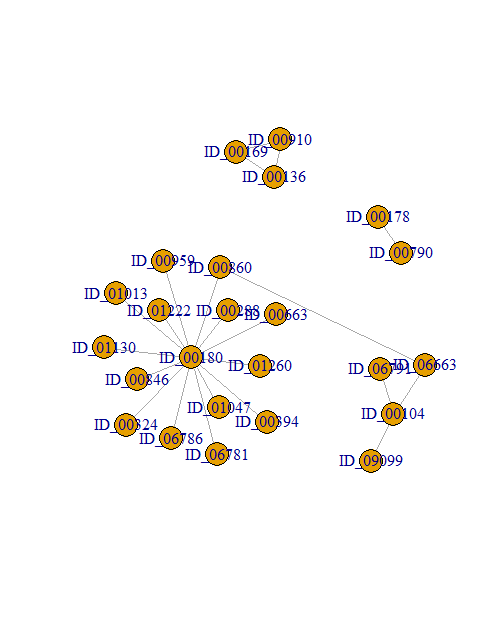
例如,下面的图包含4 components。
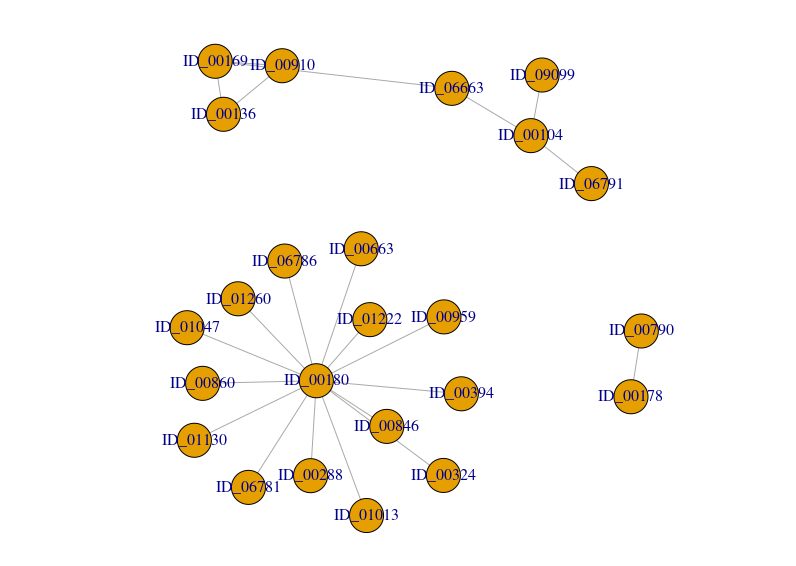
首先,我将连接all components with only one edge and take the edge randomly。我可以用下面的代码来做
graph1 <- graph_from_data_frame(g, directed = FALSE)
E(graph1)$weight <- g$new_ssp
cl <- components(graph1)

graph2 <- with(
  stack(membership(cl)),
  add.edges(
    graph1,
    c(combn(sapply(split(ind, values), sample, size = 1), 2)),
    weight = runif(choose(cl$no, 2))
  )
)第二,现在,我想在component-1 and component-2之间添加一个边。我想在2 components和rest of the component will be present in the new graph from the previous graph之间添加一个边。
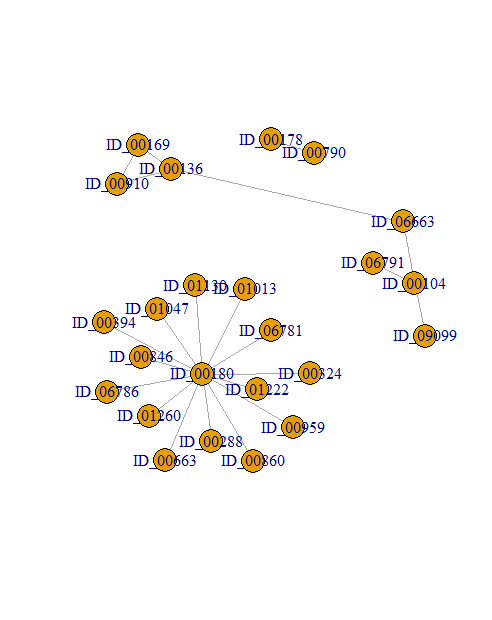
类似地,在component-1 and component-2之间添加一个边之后,新的图将包含3 component 1st (component-1 and component-2 as a 1 component because we added 1 edge), 2nd (component-3 from the main graph), and 3rd (component-4 from the main graph)。我可以用下面的代码来做
dg <- decompose.graph(graph1)
graph3 <- (dg[[1]] %u% dg[[2]])
component_subgraph_1 <- components(graph3)
graph2 <- with(
stack(membership(component_subgraph_1)),
add.edges(
graph1,
c(combn(sapply(split(ind, values), sample, size = 1), 2)),
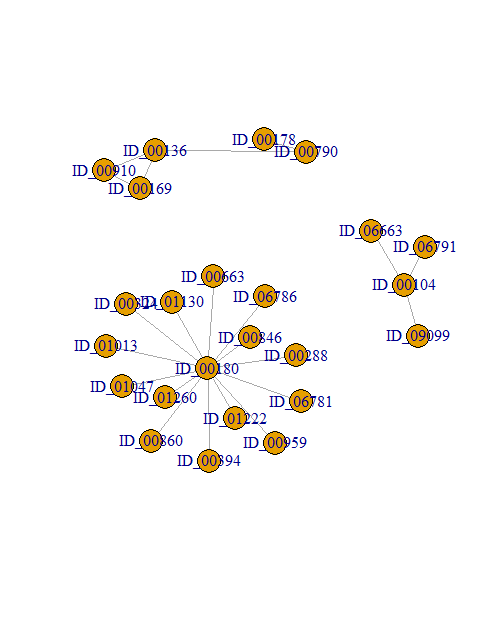
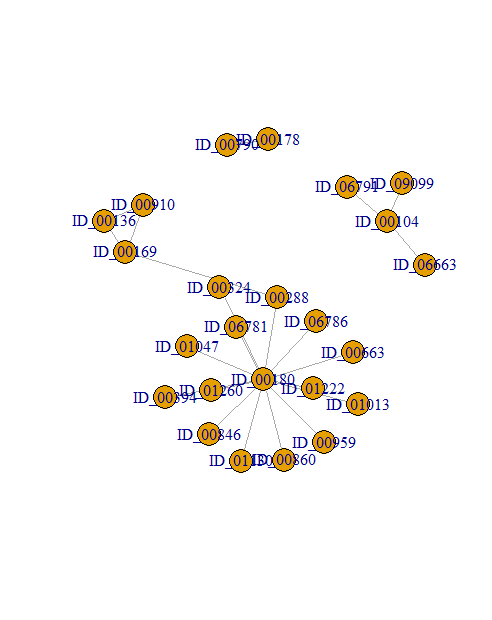
weight = 0.01))图:
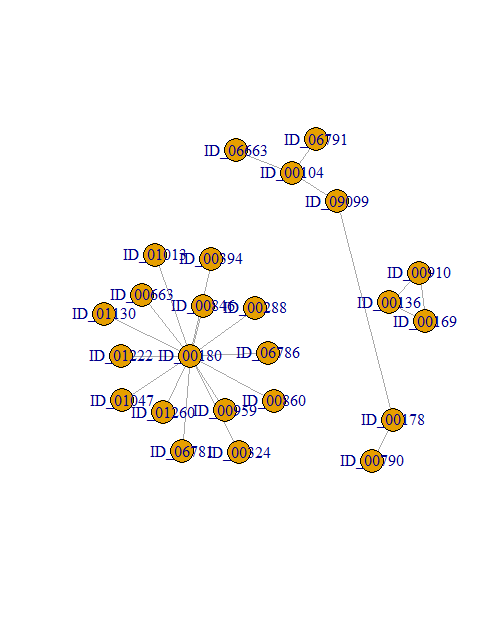
所有组合都一样。例如,component-1 and component-3、component-1 and component-4、component-2 and component-3、component-2 and component-4和component-3 and component-4。
但是,这不可能编写代码并手动更改dg[[1]]**,** dg[[2]]**,等等。此外,我的实际数据集包含了许多组件。所以,实际上,这是不可能的。知道吗,我怎么能自动这么做?**
实际上,我有一个评分函数(比如最短路径)。所以,我想在adding all components,或after adding only 2 components,after adding only 3 components和so on之后检查分数!有点像greedy algorithms。
可复制的数据:
g <- structure(list(query = structure(c(1L, 1L, 1L, 2L, 2L, 3L, 4L,
                                   5L, 5L, 5L, 5L, 5L, 5L, 5L, 5L, 5L, 5L, 5L, 5L, 5L, 5L), .Label = c("ID_00104",
                                                                                                       "ID_00136", "ID_00169", "ID_00178", "ID_00180"), class = "factor"),
               target = structure(c(16L, 19L, 20L, 1L, 9L, 9L, 6L, 11L,
                                    13L, 15L, 4L, 8L, 10L, 14L, 2L, 3L, 5L, 7L, 12L, 17L, 18L
               ), .Label = c("ID_00169", "ID_00288", "ID_00324", "ID_00394",
                             "ID_00663", "ID_00790", "ID_00846", "ID_00860", "ID_00910", "ID_00959",
                             "ID_01013", "ID_01047", "ID_01130", "ID_01222", "ID_01260", "ID_06663",
                             "ID_06781", "ID_06786", "ID_06791", "ID_09099"), class = "factor"),
               new_ssp = c(0.654172560113154, 0.919096895578551, 0.925821596244131,
                           0.860406091370558, 0.746376811594203, 0.767195767195767,
                           0.830379746835443, 0.661577608142494, 0.707520891364902,
                           0.908193484698914, 0.657118786857624, 0.687664041994751,
                           0.68586387434555, 0.874513618677043, 0.836646499567848, 0.618361836183618,
                           0.684163701067616, 0.914728682170543, 0.876297577854671,
                           0.732707087959009, 0.773116438356164)), row.names = c(NA,
                                                                                 -21L), class = "data.frame")
提前谢谢。
回答 1
Stack Overflow用户
发布于 2021-03-27 22:11:20
你实际上已经接近你想要的了。也许下面的代码可以帮到你
out <- with(
stack(membership(cl)),
lapply(
combn(split(ind, values), 2, simplify = FALSE),
function(x) {
add.edges(
graph1,
c(combn(sapply(x, sample, size = 1), 2)),
weight = 0.01
)
}
)
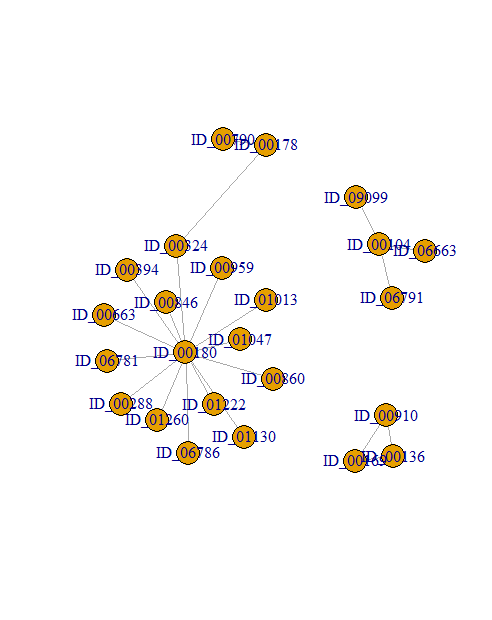
)然后你就可以跑
sapply(out, plot)形象化所有的组合。
https://stackoverflow.com/questions/66826023
复制相似问题
腾讯云开发者

Copyright © 2013 - 2026 Tencent Cloud. All Rights Reserved. 腾讯云 版权所有
深圳市腾讯计算机系统有限公司 ICP备案/许可证号:粤B2-20090059 ![]() 粤公网安备44030502008569号
粤公网安备44030502008569号
腾讯云计算(北京)有限责任公司 京ICP证150476号 | 京ICP备11018762号