
Chartjs:双x轴不具有相同的网格线
Chartjs:双x轴不具有相同的网格线
提问于 2021-03-26 08:04:08
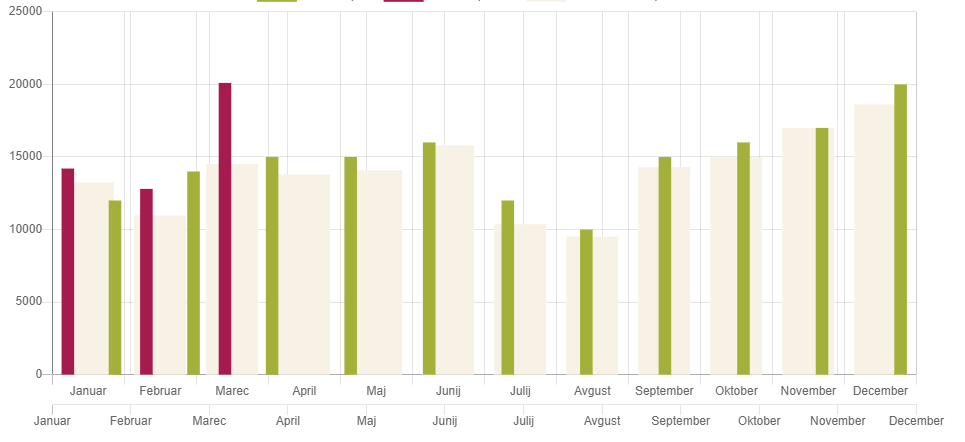
我使用的是Chart.js版本2.9.4和jQuery版本3.2.1,我使用的是条形图类型。我想要实现的是显示一个数据条的背景(米色)和两个数据条在前景(绿色和洋红色)。问题是,使用这个设置,它显示错误-x轴和网格线没有正确地对齐(我只想显示一个,但是在图片中显示了两个)。
我的数据和缩放代码是:
var activityData = {
            datasets: [
                {
                    label: 'Monthly plan',
                    backgroundColor: '#a3b13a',
                    data: [14000, 12000, 14000, 15000, 15000, 16000, 12000, 10000, 15000, 16000, 17000, 20000],
                    xAxisID: 'x-axis-1',
                    barPercentage: 0.4
                }, {
                    label: 'Month sales',
                    backgroundColor: '#a51b4d',
                    data: [14200, 12800, 20100],
                    xAxisID: 'x-axis-1',
                    barPercentage: 0.4
                },{
                    label: 'Last year sales',
                    backgroundColor: '#f8f1e5',
                    data: [13250, 10965, 14520, 13789, 14085, 15796, 10367, 9513, 14302, 14985, 16997, 18622 ],
                    xAxisID: 'x-axis-2'
                }],
            labels: monthNames
        }

        var myScales = {
            xAxes: [{
                display: true,
                stacked: true,
                id: "x-axis-2",
                type: 'category',
                ticks: {
                    beginAtZero: true
                }
            }, {
                display: true,
                stacked: false,
                id: "x-axis-1",
                type: 'category',
                ticks: {
                    beginAtZero: true
                }
            }],
            yAxes: [{
                stacked: false,
                ticks: {
                    beginAtZero: true
                }
            }]
        }
我如何解决这一问题,以正确地显示-一个酒吧在背景和两个在前景?
回答 1
Stack Overflow用户
回答已采纳
发布于 2021-03-26 11:04:01
我想出了办法,如果有人有同样的问题,我不得不添加抵消:真。
    var myScales = {
        xAxes: [{
            display: true,
            stacked: true,
            id: "x-axis-2",
            type: 'category',
            offset: true,
            ticks: {
                beginAtZero: true
            }
        }, {
            display: false,
            stacked: false,
            id: "x-axis-1",
            type: 'category',
            offset: true,
            gridLines: {
                display:false
            },
            ticks: {
                beginAtZero: true
            }
        }],
        yAxes: [{
            stacked: false,
            ticks: {
                beginAtZero: true
            }
        }]
}页面原文内容由Stack Overflow提供。腾讯云小微IT领域专用引擎提供翻译支持
原文链接:
https://stackoverflow.com/questions/66813066
复制相关文章
相似问题
腾讯云开发者

Copyright © 2013 - 2026 Tencent Cloud. All Rights Reserved. 腾讯云 版权所有
深圳市腾讯计算机系统有限公司 ICP备案/许可证号:粤B2-20090059 ![]() 粤公网安备44030502008569号
粤公网安备44030502008569号
腾讯云计算(北京)有限责任公司 京ICP证150476号 | 京ICP备11018762号