
定义高宽比时grid.arrange呈现不需要的填充
背景:我尝试使用来自gridExtra-package的grid.arrange()函数将5个情节组合成一个R标记pdf输出。对我来说,将高宽比锁定为1:1是有意义的。
问题:--这在绘制一行时工作得很好。但是,当扩展到2行时,输出会得到一个填充,它缩小了我希望保持尽可能大的地块大小。我找不到任何避免这种行为的设置(更改plot.margin没有改进)。
我提供了下面的一个极简示例(保存到..Rmd文件以使用knitr呈现),但我还附加了一些输出的屏幕转储:
图1)如果我当时只使用1行,输出看起来就像我想要的,但不幸的是,没有在相同的arrange.grid()命令中,因此在两幅图之间有一个巨大的垂直空间:
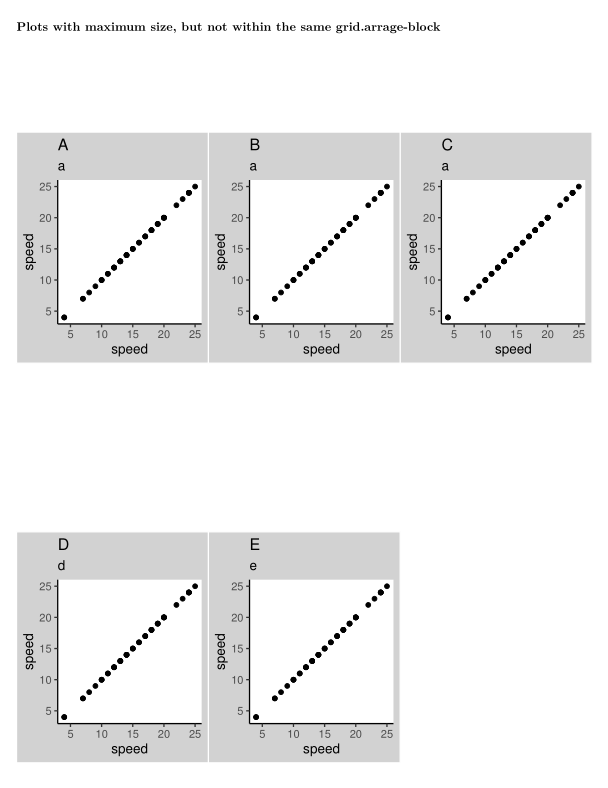
图2)在相同的grid.arrage中放置地块会导致填充(较小的地块)
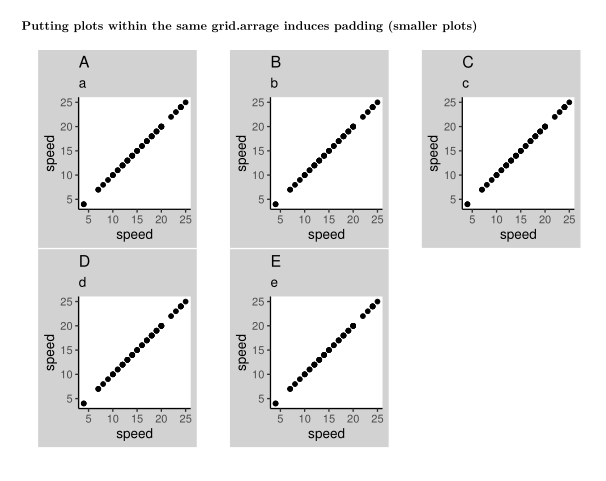
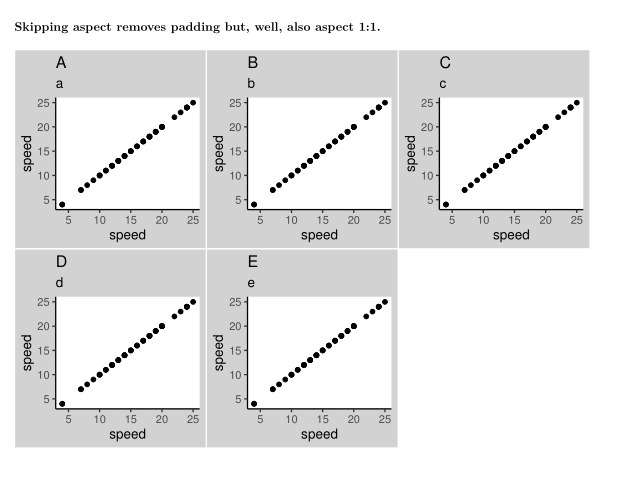
图3)跳过方面移除填充,但是,好的,也是方面1:1。
问题:有没有办法避免这种填充行为,并在相同的安排中获得多行arrange.grids的最大大小?
最小工作示例
---
title: "grid.arrange() padding with aspect-ratio problems"
subtitle: "a miminum working example"
output: pdf_document
fontsize: 10pt
---

```{r setup, include=FALSE}
图书馆(针织品)
图书馆(Ggplot2)
图书馆(GridExtra)
Knitr::opts_chunk$set(回声=假)
### Plots with maximum size, but not within the same grid.arrage-block
```{r plot_problems, echo=FALSE, warning=FALSE, message=FALSE}
plot_speed_dist <- ggplot(cars,aes(速度,dist)) +
geom_point()plot.background=element_rect(fill="lightgrey")) aspect_1_theme <- theme_classic() +主题(aspect.ratio=1)
theme(plot.background=element_rect(fill="lightgrey")) + no_aspect_theme <- theme_classic()
grid.arrange(arrangeGrob(
plot_speed_dist + ggtitle('A', subtitle = "a") + aspect_1_theme,plot_speed_dist + ggtitle('B', subtitle = "a") + aspect_1_theme,plot_speed_dist + ggtitle('C', subtitle = "a") + aspect_1_theme,nrow=1, ncol=3))grid.arrange(arrangeGrob(
plot_speed_dist + ggtitle('D', subtitle = "d") + aspect_1_theme,plot_speed_dist + ggtitle('E', subtitle = "e") + aspect_1_theme,nrow=1, ncol=3))### Putting plots within the same grid.arrage induces padding (smaller plots)
```{r plot_problems_2, echo=FALSE, warning=FALSE, message=FALSE}grid.arrange(arrangeGrob(
plot_speed_dist + ggtitle('A', subtitle = "a") + aspect_1_theme,plot_speed_dist + ggtitle('B', subtitle = "b") + aspect_1_theme,plot_speed_dist + ggtitle('C', subtitle = "c") + aspect_1_theme,plot_speed_dist + ggtitle('D', subtitle = "d") + aspect_1_theme,plot_speed_dist + ggtitle('E', subtitle = "e") + aspect_1_theme,nrow=2, ncol=3), newpage = T)### Skipping aspect removes padding but, well, also aspect 1:1.
```{r plot_problems_3, echo=FALSE, warning=FALSE, message=FALSE}grid.arrange(arrangeGrob(
plot_speed_dist + ggtitle('A', subtitle = "a") + no_aspect_theme,plot_speed_dist + ggtitle('B', subtitle = "b") + no_aspect_theme,plot_speed_dist + ggtitle('C', subtitle = "c") + no_aspect_theme,plot_speed_dist + ggtitle('D', subtitle = "d") + no_aspect_theme,plot_speed_dist + ggtitle('E', subtitle = "e") + no_aspect_theme,nrow=2, ncol=3), newpage = T)回答 1
Stack Overflow用户
发布于 2021-03-10 03:13:22
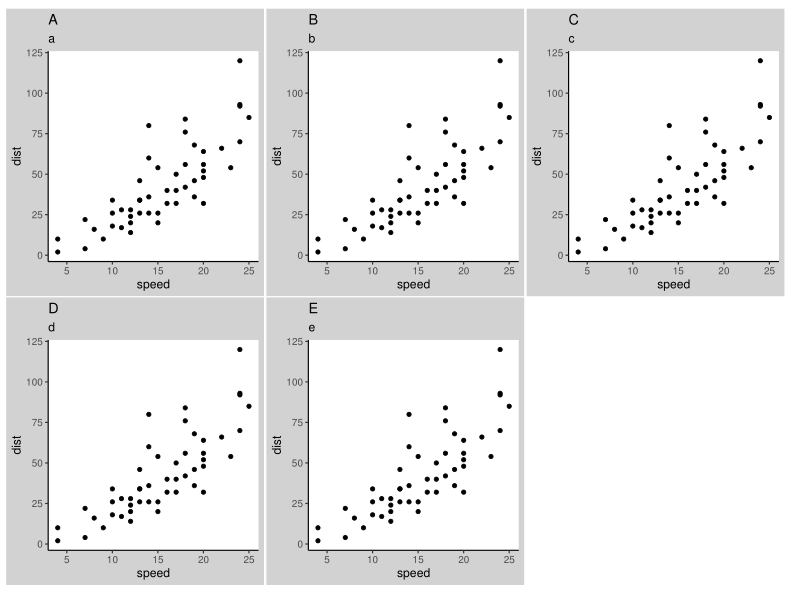
一种选择是在代码块开头设置fig.width和fig.height。稍微玩一玩,我们会发现{r plot_problems_2, echo=FALSE, warning=FALSE, message=FALSE, fig.height=7.25, fig.width=9.8}生成了下面的情节。文字和圆点要小一点,但也许你可以做出妥协。
https://stackoverflow.com/questions/66548163
复制相似问题
腾讯云开发者

Copyright © 2013 - 2026 Tencent Cloud. All Rights Reserved. 腾讯云 版权所有
深圳市腾讯计算机系统有限公司 ICP备案/许可证号:粤B2-20090059 ![]() 粤公网安备44030502008569号
粤公网安备44030502008569号
腾讯云计算(北京)有限责任公司 京ICP证150476号 | 京ICP备11018762号