
不规则数据的Matplotlib Contourf
不规则数据的Matplotlib Contourf
提问于 2021-03-07 18:35:55
我有一个土壤性质的数据,深度在不同的x点。井眼数据的深度和数量都不相等,所以我必须标准化代码。如果所有的钻孔有相同的数据和深度,没有问题,np.meshgrid将工作良好。然而,在我的例子中,我遇到了麻烦,无法绘制轮廓图。
是不可能还是我做错了什么?
input_data = {
    "BH1": {
        "Chainage": 50,
        "Depth": [2, 3, 4, 5, 6,7,10],
        "Parameter": [10, 5, 12, 56, 34,45,62],
    },
    "BH2": {"Chainage": 0, "Depth": [2, 3, 4, 5, 6, 18], "Parameter": [2, 4, 12, 23, 12, 33]},
    "BH3": {
        "Chainage": -50,
        "Depth": [2, 3, 4, 5, 6, 9],
        "Parameter": [12, 14, 22, 33, 32, 70],
    },
}

import numpy as np
import matplotlib.pyplot as plt

#PREPROCESSING OF DATA

depth_lengths = []
for i in input_data.keys():
    depth_lengths.append(len(input_data[i]["Depth"]))

max_depth_length = max(depth_lengths)

for i in input_data.keys():
    while len(input_data[i]["Depth"]) < max_depth_length:
        input_data[i]["Depth"].append(None)
        input_data[i]["Parameter"].append(None)

parameter = []

for i in range(max_depth_length):
    temp = []
    for j in input_data.keys():
        temp.append(input_data[j]["Parameter"][i])
    parameter.append(temp)


depth = []
chainage = []
parameter2 = []
for i in input_data.keys():
    for j in input_data[i]["Depth"]:
        depth.append(j)
    for j in input_data[i]["Parameter"]:
        parameter2.append(j)
    chainage.append(input_data[i]["Chainage"])

# X, Y = np.meshgrid(chainage, depth)

parameter2 = np.array(parameter2*3).reshape(-1,3)


fig,ax=plt.subplots()
ax.contourf(X, Y, parameter2, 8, alpha=.75, cmap='jet')回答 2
Stack Overflow用户
回答已采纳
发布于 2021-03-07 22:38:44
对于没有在常规网格上组织的数据,tricontourf通过三角形连接输入点来创建等高线图。您可以使用np.repeat创建与chainages长度相同的chainage列表(或一维数组),只需循环遍历depths和parameters创建相应的列表。
import matplotlib.pyplot as plt
import numpy as np
input_data = {"BH1": {"Chainage": 50,
"Depth": [2, 3, 4, 5, 6, 7, 10],
"Parameter": [10, 5, 12, 56, 34, 45, 62]},
"BH2": {"Chainage": 0,
"Depth": [2, 3, 4, 5, 6, 18],
"Parameter": [2, 4, 12, 23, 12, 33]},
"BH3": {"Chainage": -50,
"Depth": [2, 3, 4, 5, 6, 9],
"Parameter": [12, 14, 22, 33, 32, 70]}}
chainage = np.repeat([v["Chainage"] for v in input_data.values()], [len(v["Depth"]) for v in input_data.values()])
depth = [d for v in input_data.values() for d in v["Depth"]]
parameter = [p for v in input_data.values() for p in v["Parameter"]]
fig, (ax1, ax2) = plt.subplots(ncols=2, figsize=(16, 5))
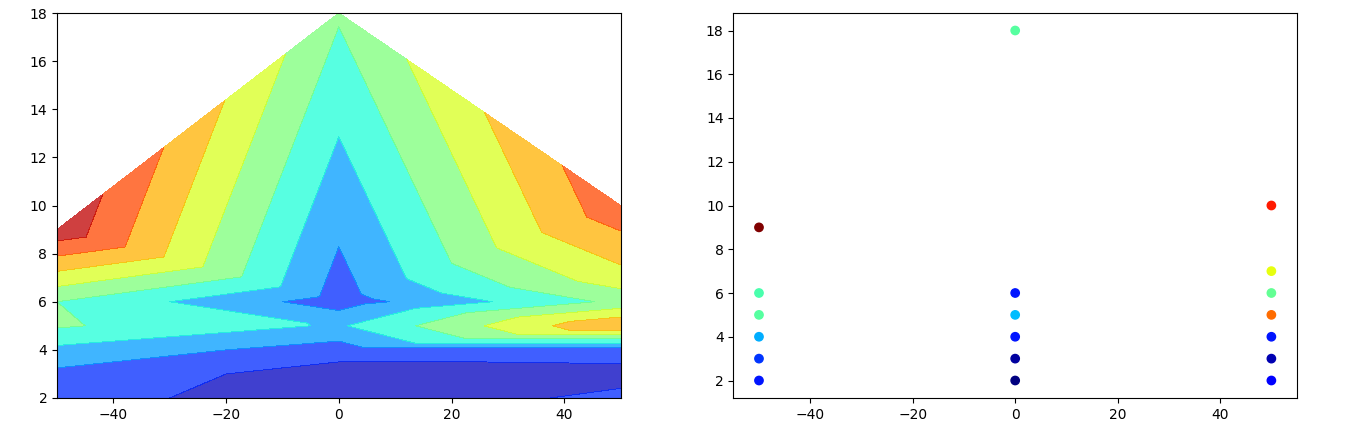
ax1.tricontourf(chainage, depth, parameter, levels=8, alpha=.75, cmap='jet')
ax2.scatter(chainage, depth, c=parameter, cmap='jet')
plt.show()右边的图显示输入,颜色为散点图。左图显示相应的等高线图。
Stack Overflow用户
发布于 2021-03-07 21:58:28
不确定这是否是您的意图,但这将生成一个填充的等高线图使用您的数据。Z(参数)有很多缺失的值,所以图看起来不太好。
X=     [[50,-50,-50,-50,-50,-50,-50,-50,-50],
        [0,   0,  0,  0,  0,  0, 0, 0, 0],
        [50, 50, 50, 50, 50, 50, 50, 50, 50]]
Y=     [[2, 3, 4, 5, 6, 7, 9, 10, 18],
        [2, 3, 4, 5, 6, 7, 9, 10, 18],
        [2, 3, 4, 5, 6, 7, 9, 10, 18]]
z= 3*np.array([[12, 14, 22, 33, 32, np.NaN, 70, np.NaN, np.NaN],
    [2, 4, 12, 23, 12, np.NaN, np.NaN, np.NaN, 33],
    [10, 5, 12, 56, 34,45,np.NaN,  62, np.NaN]])

plt.contourf(X, Y, z, 8, alpha=.75, cmap='jet')
plt.show()页面原文内容由Stack Overflow提供。腾讯云小微IT领域专用引擎提供翻译支持
原文链接:
https://stackoverflow.com/questions/66520021
复制相关文章
相似问题
腾讯云开发者

Copyright © 2013 - 2026 Tencent Cloud. All Rights Reserved. 腾讯云 版权所有
深圳市腾讯计算机系统有限公司 ICP备案/许可证号:粤B2-20090059 ![]() 粤公网安备44030502008569号
粤公网安备44030502008569号
腾讯云计算(北京)有限责任公司 京ICP证150476号 | 京ICP备11018762号