
在cartopy mercator投影上画一个圆
对于一个项目,我需要创建一个可视化,在地图上的一些位置画一个圆圈。可视化使用Cartopy诉0.18.0来呈现地图。它使用GoogleTiles类获取并显示相关区域的瓷砖,并使用add_patch(Patch.Circle(..., transform=ccrs.PlateCarree()))方法绘制圆圈。
tiles = GoogleTiles()
fig = plt.figure(figsize=(15,15))
ax = fig.add_subplot(1, 1, 1, projection=tiles.crs)
ax.set_extent((-121.8,-122.55,37.25,37.85))
ax.add_image(tiles, 11)
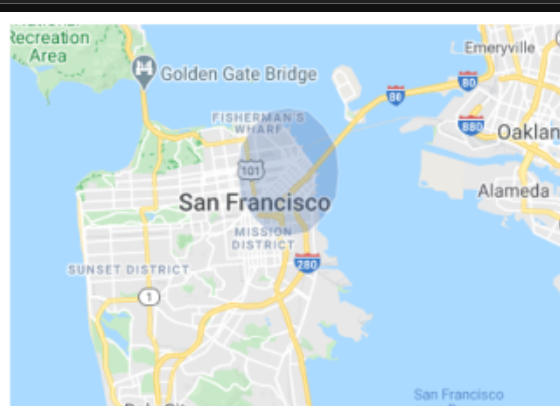
ax.add_patch(Patch.Circle(xy=[-122.4015173428571, 37.78774634285715], radius = 0.021709041989311614 + 0.005, alpha=0.3, zorder=30, transform=ccrs.PlateCarree()))
plt.show()然而,尽管我尝试了几个转换对象,我要么得到一个椭圆而不是圆圈(例如使用ccrs.PlateCarree()),要么根本没有圆圈(例如使用ccrs.Mercator())。
我在网上找到了几种不同的解决方案(例如正投影中的人造画圆),然而,它们并不适用于Mercator投影,我很遗憾地缺乏投影/转换知识来使它们适应我的问题。
生成循环补丁的唯一方法是将fig.add_subplot上的fig.add_subplot参数设置为ccrs.PlateCarree()。然而,这扭曲了地图,标签变得模糊,因此可悲的是,这不是一个可以接受的解决方案。
由于该项目即将到期,希望能迅速作出答复。
回答 1
Stack Overflow用户
发布于 2021-02-27 18:30:05
谢谢@swatchai,这是缺少的提示,所以对于那些不受测试的人来说,代码现在看起来是这样的,而且它确实工作了!万岁!
tiles = GoogleTiles()
fig = plt.figure(figsize=(15,15))
ax = fig.add_subplot(1, 1, 1, projection=tiles.crs)

ax.set_extent((-121.8,-122.55,37.25,37.85))

ax.add_image(tiles, 11)

# The diameter is in degrees in EPSG:4326 coordinates therefore, the degrees have
# to be converted to km. At 37N the degree latitude is 11.0977 km.
ax.tissot(rad_km=(0.021709041989311614 + 0.005) * 11.0977, lons=[-122.4015], lats=[37.7877], alpha=0.3)

plt.show()
在执行上述代码时,将引发以下警告,但它对结果有明显的影响:
/opt/conda/lib/python3.8/site-packages/cartopy/mpl/geoaxes.py:761: UserWarning: Approximating coordinate system <cartopy._crs.Geodetic object at 0x7fa4c7529770> with the PlateCarree projection.
  warnings.warn('Approximating coordinate system {!r} with the '

所以再次感谢你救了我的命!
https://stackoverflow.com/questions/66400300
复制相似问题
腾讯云开发者

Copyright © 2013 - 2026 Tencent Cloud. All Rights Reserved. 腾讯云 版权所有
深圳市腾讯计算机系统有限公司 ICP备案/许可证号:粤B2-20090059 ![]() 粤公网安备44030502008569号
粤公网安备44030502008569号
腾讯云计算(北京)有限责任公司 京ICP证150476号 | 京ICP备11018762号