
NumPy快速迭代槽图像
NumPy快速迭代槽图像
提问于 2021-01-21 23:34:15
我试图在一个矩形形状的二值图像中得到极值点(或多或少)。二值图像,其中我想在我的矩形(黑色)对象周围找到一些矩形边界。
我想得到4分像这样(图像),以便使用cv2.minAreaRect(点数),并获得一个边界框。问题是,我目前的算法在寻找这些边界方面非常慢,因为我必须迭代这个二值图像4次(2D NumPy数组)。
def findCornerOne(frame):
    #threshold that handles the case when you have some noise around your object (as in the photo
    #above)
    global thresholdVal
    x = frame.shape[0]
    y = frame.shape[1]
    point = None
    firstFound = True
    count = 0
    for i in range(0, y):
        for j in range(0, x):
            if frame[j][i] != 0:
                if firstFound:
                    point = [i, j]
                    firstFound = False
                 count += 1
            else:
                if count <= thresholdVal:
                    firstFound = True
                    count = 0
                else:
                    return point

    return None
用NumPy和标准python (没有任何库)是否有办法加快速度?我正在考虑使用numpy.where,但我不知道如何指定在哪个轴上搜索,并找到边界点。
最后,我想得到一些像图像中的红色点:图像
回答 1
Stack Overflow用户
回答已采纳
发布于 2021-01-22 01:17:51
我提出的解决方案可以总结如下:
- 将原始图像转换为灰度,并通过Otsu的方法进行二值化。
- 计算二值图像的连接分量。
- 选择最大的区域。
- 确定该区域的极端坐标。
import numpy as np
from skimage import io
from skimage.measure import label, regionprops
from skimage.filters import threshold_otsu
from skimage.color import rgb2gray

img = io.imread('https://i.stack.imgur.com/FIQjh.png')[:, :, :3]
gray = rgb2gray(img)

thresholded = gray > threshold_otsu(gray)
labels = label(thresholded, background=1)
props = measure.regionprops(labels)

largest = sorted(props, key=lambda x: x.area, reverse=True)[0]

top = np.where(largest.coords[:, 0] == largest.coords[:, 0].min())
bottom = np.where(largest.coords[:, 0] == largest.coords[:, 0].max())
left = np.where(largest.coords[:, 1] == largest.coords[:, 1].min())
right = np.where(largest.coords[:, 1] == largest.coords[:, 1].max())

extremes = np.concatenate([top[0], bottom[0], left[0], right[0]])
corners = largest.coords[extremes]
上面的代码不仅依赖于NumPy,而且也依赖于scikit-映像,而且效率相当高。请注意,这种方法返回超过4个点(您可以很容易地将坐标聚在一起,只得到4个点)。
In [419]: corners
Out[419]:
array([[ 69, 417],
       [ 69, 418],
       [ 69, 419],
       [ 69, 420],
       [ 69, 421],
       [256, 211],
       [256, 212],
       [256, 213],
       [256, 214],
       [101, 187],
       [102, 187],
       [103, 187],
       [104, 187],
       [227, 460],
       [228, 460],
       [229, 460],
       [230, 460],
       [231, 460],
       [232, 460],
       [233, 460],
       [234, 460],
[235, 460]], dtype=int64)如果您想获得一个边界框,则不需要手动计算它们,因为regionprops返回的属性有一个键bbox,其中包含边界框的坐标:
In [420]: largest.bbox
Out[420]: (69, 187, 257, 461)
Demo
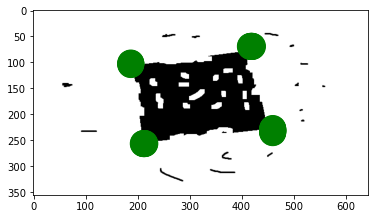
import matplotlib.pyplot as plt
from matplotlib.patches import Circle

patches = [Circle((col, row), radius=25, color='green')
           for row, col in corners]

fig, ax = plt.subplots(1)
ax.imshow(img)
for p in patches:
    ax.add_patch(p)
plt.show(fig)
页面原文内容由Stack Overflow提供。腾讯云小微IT领域专用引擎提供翻译支持
原文链接:
https://stackoverflow.com/questions/65837329
复制相关文章
相似问题
腾讯云开发者

Copyright © 2013 - 2026 Tencent Cloud. All Rights Reserved. 腾讯云 版权所有
深圳市腾讯计算机系统有限公司 ICP备案/许可证号:粤B2-20090059 ![]() 粤公网安备44030502008569号
粤公网安备44030502008569号
腾讯云计算(北京)有限责任公司 京ICP证150476号 | 京ICP备11018762号