
每个组的自定义颜色+类别组合雨云图
每个组的自定义颜色+类别组合雨云图
提问于 2020-12-30 00:51:33
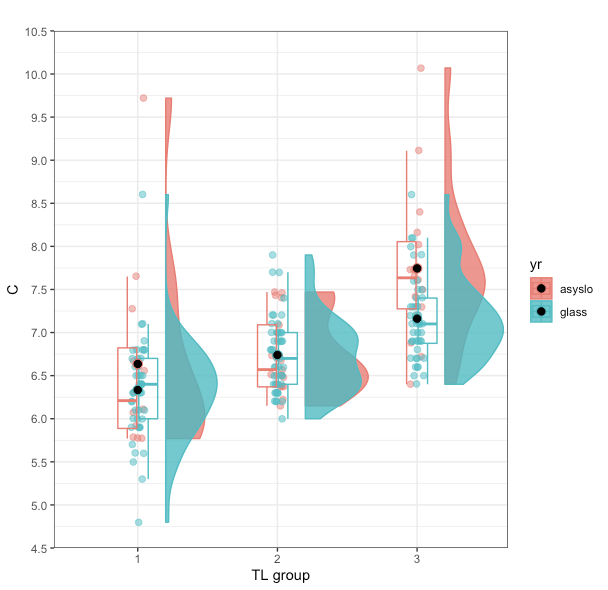
我有一个雨云图:
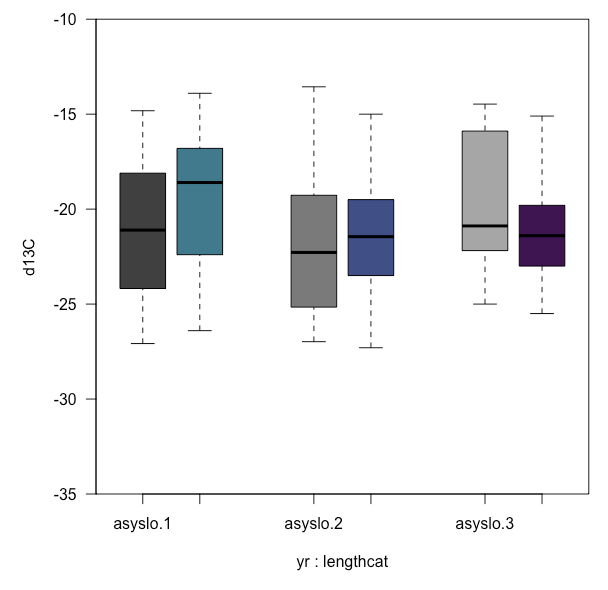
但是,我希望TL组和yr的每一个组合都是不同的颜色,就像人们在基盒图()中所做的那样:
我尝试使用以下代码来绘制雨云图:
Y_C_rain= ggplot(yct_rain, aes(y=d13C, x=lengthcat,fill = yr,color=yr)) +
   geom_flat_violin(position = position_nudge(x = .2, y =0), alpha = .8)+
   geom_point(aes(y = , color = yr),
             position = position_jitter(width = .05), size = 2, alpha = .5) +
   geom_boxplot(width = .3, guides = FALSE, outlier.shape = NA, alpha = 0, notch = FALSE) +
   stat_summary(fun= mean, geom = "point", shape = 21, size = 3, fill = "black") +
   scale_y_continuous (limits = c(-35,-10),expand = c(0,0),breaks=seq(-35,-10,5)) +
   ylab("d13C") + xlab("TL group") +
   ggtitle("YCT d13C") +
   theme_bw() +
   scale_colour_discrete(my_clrs_yct)+
   scale_fill_discrete(my_clrs_yct)
Y_C_rain我知道雨图中的颜色需要用scale_fill_xxx的一些变体编码,但是我碰到了一个路障,因为似乎每个点都需要有自己的颜色。因此,只列出6种颜色的scale_fill_xxx的变化是不起作用的。
回答 1
Stack Overflow用户
回答已采纳
发布于 2020-12-30 01:46:12
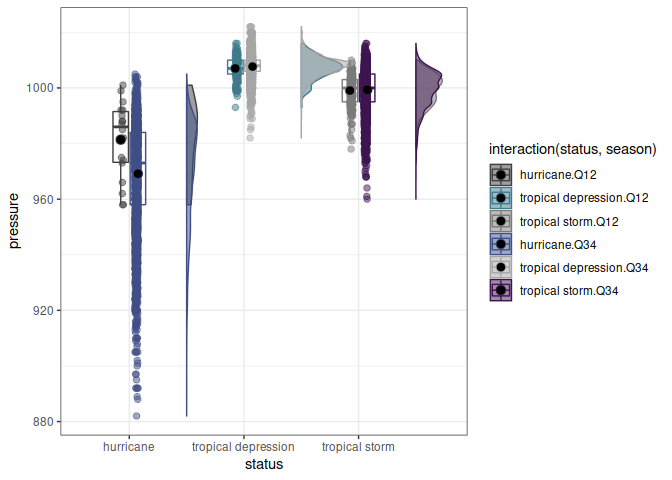
你想要这样的东西吗?
library(dplyr)
library(data.table)
library(ggplot2)
# used geom_flat_violin from https://gist.github.com/dgrtwo/eb7750e74997891d7c20

my_clrs_yct <- c("#404040", "#407a8c", "#7a7a7a", "#404f86", "#a6a6a6", "#3e1451")

## used storms from dplyr as reproducible example
data("storms")
setDT(storms)
storms[, season:= factor(ifelse(month <=6, "Q12", "Q34"))]

ggplot(storms, aes(x=status, y=pressure, color=interaction(status, season),
                   fill=interaction(status, season))) +
    geom_point(aes(color = interaction(status, season)),
               position = position_jitterdodge(
                   jitter.width=.1, dodge.width=.25), size = 2, alpha = .5)+
    geom_flat_violin(position = position_nudge(x = .5, y =0), alpha = .5)+
    geom_boxplot(width = .3, guides = FALSE, outlier.shape = NA, alpha = 0)+
    stat_summary(fun = mean, geom = "point", shape = 21, size = 3,
                 fill = "black", position = position_nudge(x = c(-.075,.075), y =0)) +
    theme_bw() +
    scale_colour_manual(values=my_clrs_yct) +
    scale_fill_manual(values=my_clrs_yct)
页面原文内容由Stack Overflow提供。腾讯云小微IT领域专用引擎提供翻译支持
原文链接:
https://stackoverflow.com/questions/65500657
复制相关文章
相似问题
腾讯云开发者

Copyright © 2013 - 2026 Tencent Cloud. All Rights Reserved. 腾讯云 版权所有
深圳市腾讯计算机系统有限公司 ICP备案/许可证号:粤B2-20090059 ![]() 粤公网安备44030502008569号
粤公网安备44030502008569号
腾讯云计算(北京)有限责任公司 京ICP证150476号 | 京ICP备11018762号