
在python中编辑标记形状
在python中编辑标记形状
提问于 2020-12-22 16:03:23
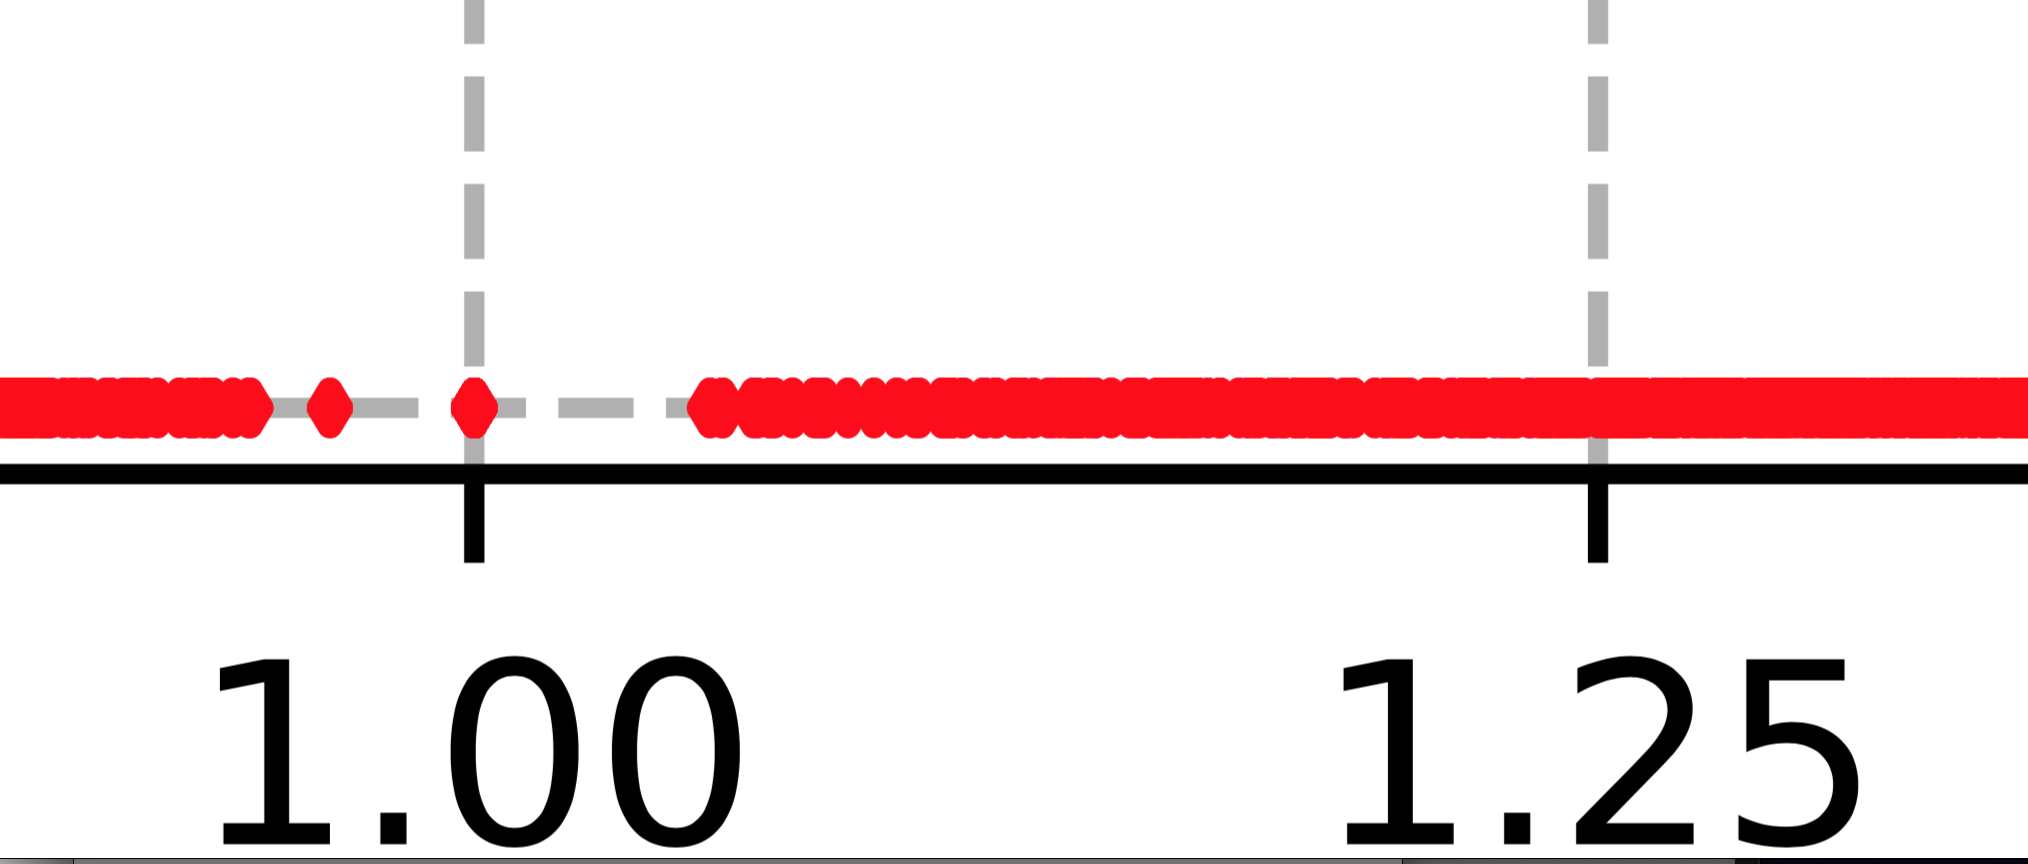
我在CDF图的x轴上使用菱形指针来显示某些数据的分布。由于数据的数量很高,这些点紧密相连,无法区分。我想知道是否有办法使散点图上的钻石标记更加尖锐。
回答 2
Stack Overflow用户
回答已采纳
发布于 2020-12-23 07:46:14
虽然我喜欢@Stef创建新标记符号的答案,但您也可以根据它们与其他点的距离来调整现有符号的大小:
import matplotlib.pyplot as plt
import numpy as np
from sklearn.neighbors import NearestNeighbors

# create random data
x = np.random.rand(10)
y = np.ones(len(x))

# open figure + axes
fig,axs = plt.subplots(1,2)
# standard scatter-plot
MarkerSize = 40
axs[0].scatter(x,y,s=MarkerSize)

# re-arrange data
xy = []
for x1,y1 in zip(x,y):
    xy.append([x1,y1])
# find nearest neighbors to itself (skip the first column because it finds the exact same element, i.e. with zero distance)
dst,idx = NearestNeighbors(n_neighbors=2).fit(xy).kneighbors(xy)
dst = dst[:,1]

# create a vector for the marker-size
S = dst/dst.max()*MarkerSize
# scatter plot with adjusted marker-size
axs[1].scatter(x,y,s=S)
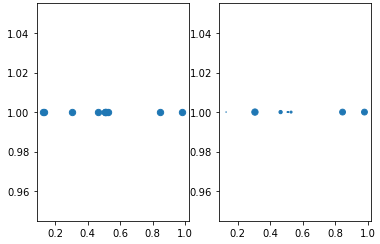
我使用了scikit-learn的sklearn.neighbors.NearestNeighbors()来计算点之间的最小距离,并将其作为缩放因子传递给matplotlib.pyplot.scatter()的size参数s=。那里是scatter()中标记大小参数的一个小教程。
Stack Overflow用户
发布于 2020-12-22 16:46:46
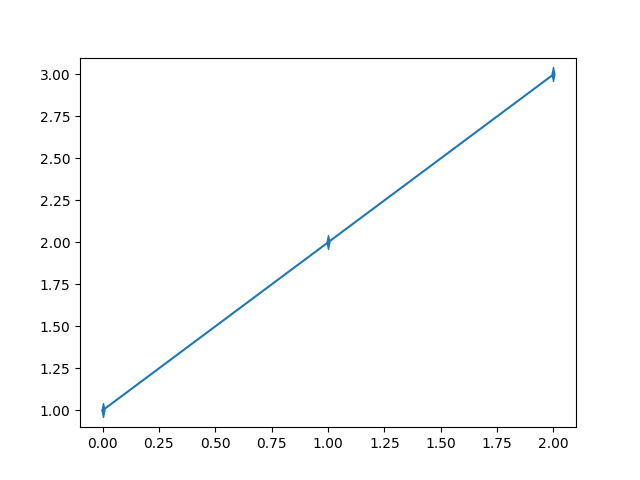
您可以从路径中定义自己的标记,请参阅标记路径示例。
import matplotlib.pyplot as plt
import matplotlib.path as mpath

pointed_diamond = mpath.Path([[0,-.5],[-.1,0],[0,.5],[.1,0],[0,-.5]], [1,2,2,2,79])
plt.plot([1,2,3], marker=pointed_diamond, markersize=10)
页面原文内容由Stack Overflow提供。腾讯云小微IT领域专用引擎提供翻译支持
原文链接:
https://stackoverflow.com/questions/65411928
复制相关文章
相似问题
腾讯云开发者

Copyright © 2013 - 2026 Tencent Cloud. All Rights Reserved. 腾讯云 版权所有
深圳市腾讯计算机系统有限公司 ICP备案/许可证号:粤B2-20090059  粤公网安备44030502008569号
腾讯云计算(北京)有限责任公司 京ICP证150476号 | 京ICP备11018762号