
尝试添加gnuket直方图标签时出错
尝试添加gnuket直方图标签时出错
提问于 2020-12-17 19:53:45
我对gnuplot很陌生,我正在尝试绘制这些数据(gnuplot从stdin接收到这个输入):
Regular 5
Block 3
Symbolic 8
Char 3
Socket 7
使用这个gnuplot代码:
set style data histograms
set style fill solid
set terminal png
set output "plot.png"

plot '-' using 2:xtic(1), \
'' using 0:($2 + .1) with labels notitle我得到了错误Not enough columns for this style。我做错了什么?如果删除带有标签的最后一行,则可以绘制直方图。如何修改它以使数据标签位于每个直方图栏的顶部?
回答 2
Stack Overflow用户
回答已采纳
发布于 2020-12-17 20:32:33
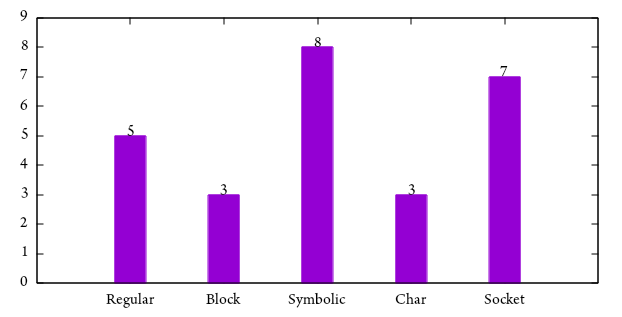
x y text需要三列信息with labels。你给了坐标但没有真正的短信。试一试
$DATA << EOD
Regular 5
Block 3
Symbolic 8
Char 3
Socket 7
EOD

set style data histograms
set style fill solid
set yrange [0:*]
plot $DATA using 2:xtic(1), \
    '' using 0:($2 + .1):2 with labels notitle
Stack Overflow用户
发布于 2020-12-17 20:32:56
试试这个:
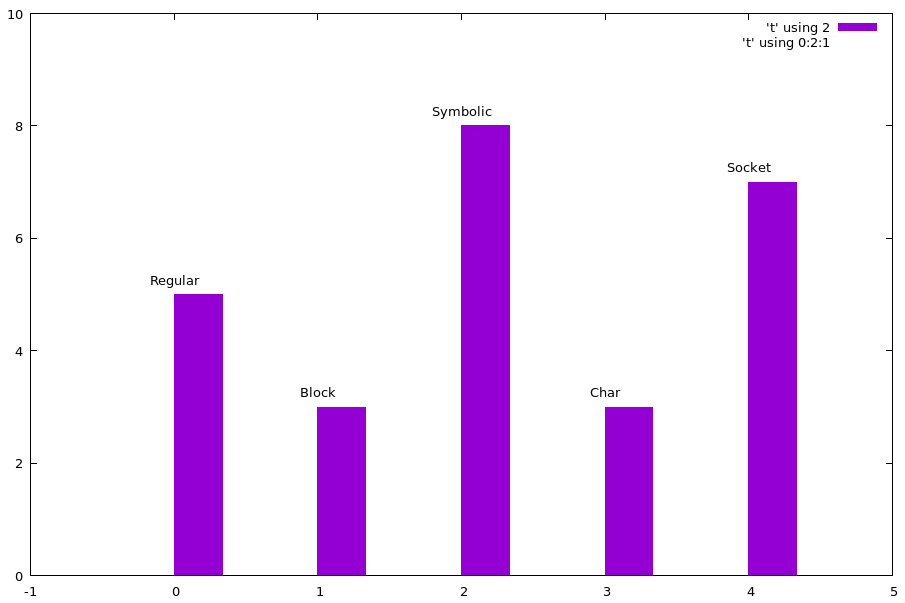
plot 'input_file' using 2, '' using 0:2:1 with labels offset 0, char 1请注意,我在一个名为input_file的文件中添加了这些值,并将set yrange [0:10]设置为使绘图更好看。
这意味着:
页面原文内容由Stack Overflow提供。腾讯云小微IT领域专用引擎提供翻译支持
原文链接:
https://stackoverflow.com/questions/65347464
复制相关文章
相似问题
腾讯云开发者

Copyright © 2013 - 2026 Tencent Cloud. All Rights Reserved. 腾讯云 版权所有
深圳市腾讯计算机系统有限公司 ICP备案/许可证号:粤B2-20090059  粤公网安备44030502008569号
腾讯云计算(北京)有限责任公司 京ICP证150476号 | 京ICP备11018762号