
无法将ggproto对象一起添加
我目前正在开发一个发亮的应用程序。我必须用几个选择输入和一个复选框输入来制作多个方框。我几乎完成了我的任务,现在我只需要完成它,这样每次我改变选择的物种时,规模都保持不变(当然,除非其他变量被输入)。
我的代码如下所示:
library(shiny)
library(palmerpenguins)
library(dplyr)
library(ggplot2)

data <- na.omit(penguins)

colnames(data) <- c("Species",
                    "Island",
                    "Bill Length (mm)",
                    "Bill Depth (mm)",
                    "Flipper Length (mm)",
                    "Body Mass (g)",
                    "Sex",
                    "Year")

data.numeric <- data[, c(3:6, 8)]

data.categorical <- data[, c(1,7)]


ui <- fluidPage(
  headerPanel("Penguin boxplots"),
  selectInput("ycol",
              "Numeric Variable",
              names(data.numeric),
              selected = names(data.numeric)[3]),
  selectInput("xcol",
              "Categorical Variable",
              names(data.categorical),
              selected = names(data.categorical)[2]),
  checkboxInput("split",
                "Split levels by Island",
                value = FALSE),
  selectInput("species",
              "Species Type",
              c("Unspecified", levels(data$Species))),
  mainPanel(
    plotOutput("plot1")
  ))


# 4. Use a select input to allow the user to view separate plotting
# panels for each species, with each plot panel on the same scale.


server <- function(input, output){
  output$plot1 <- renderPlot({
    par(mar = c(5, 4.1, 0, 1))

    if (input$species == "Unspecified"){


      if (input$split) {
        ggplot(data, aes(x = data[[input$xcol]], y = data[[input$ycol]], fill = Island)) +
          geom_boxplot(na.rm = TRUE) +

          if (input$ycol == "Bill Length (mm)"){
              coord_cartesian(ylim = c(30, 60))
          } else if (input$ycol == "Bill Depth (mm)"){
            coord_cartesian(ylim = c(12.5, 21.5))
          } else if (input$ycol == "Flipper Length(mm)"){
            coord_cartesian(ylim = c(170, 232))
          } else if (input$ycol == "Body Mass (g)"){
            coord_cartesian(ylim = c(2500, 6500))
          } else if (input$ycol == "Year"){
            coord_cartesian(ylim = c(2006, 2009))
          } +
          xlab(input$xcol) +
          ylab(input$ycol) +
          scale_x_discrete(labels = c("Female", "Male")) +
          theme(text = element_text(size = 15))

      } else {
        ggplot(data, aes(x = data[[input$xcol]], y = data[[input$ycol]])) +
          geom_boxplot(na.rm = TRUE) +
          if (input$ycol == "Bill Length (mm)"){
            coord_cartesian(ylim = c(30, 60))
          } else if (input$ycol == "Bill Depth (mm)"){
            coord_cartesian(ylim = c(12.5, 21.5))
          } else if (input$ycol == "Flipper Length(mm)"){
            coord_cartesian(ylim = c(170, 232))
          } else if (input$ycol == "Body Mass (g)"){
            coord_cartesian(ylim = c(2500, 6500))
          } else if (input$ycol == "Year"){
            coord_cartesian(ylim = c(2006, 2009))
          } +
          xlab(input$xcol) +
          ylab(input$ycol) +
          theme(text = element_text(size = 15))
      }


    } else {


      data <- data %>%
        filter(data$Species == input$species)
      if (input$split) {
        ggplot(data, aes(x = data[[input$xcol]], y = data[[input$ycol]], fill = Island)) +
          geom_boxplot(na.rm = TRUE) +
          xlab(input$xcol) +
          ylab(input$ycol) +
          scale_x_discrete(labels = c("Female", "Male")) +
          theme(text = element_text(size = 15))

      } else {
        ggplot(data, aes(x = data[[input$xcol]], y = data[[input$ycol]])) +
          geom_boxplot(na.rm = TRUE) +
          xlab(input$xcol) +
          ylab(input$ycol) +
          theme(text = element_text(size = 15))
      }
    }


  })
}


shinyApp(ui = ui, server = server)当我运行包含else if (input$ycol == "Year"){ coord_cartesian(ylim = c(2006, 2009))}的行时,会出现以下错误:无法将ggproto对象一起添加。您忘了将此对象添加到ggplot对象中吗?
我不知道我在哪里出错,或者我只是忽略了某种语法错误。
附注:代码还没有完成-我仍然需要添加更多的代码来控制鳞片,当物种不是“未指定的”,但我不会这样做,直到这个问题得到解决。
回答 1
Stack Overflow用户
发布于 2020-12-10 23:13:30
您可以通过创建一个返回所需的coord_cartesian语句的函数来简化事情。然后,可以使用+将该函数添加到ggplot中,就像在通常的ggket工作流中一样。
下面的示例使用示例中的硬编码选项。但是,如果您能够提供关于如何选择这些范围的更多信息,则可以以更自动化的方式获得y-范围,而不必显式地对每一种可能的情况进行硬编码。
在下面的示例中,case_when语句返回适当的ylim值以输入给coord_cartesian。如果input$ycol与任何选项不匹配,case_when将返回ylim=c(NA,NA),这将导致ggplot保持默认的轴范围。
# I've included only 3 choices. Add in as many additional choices as needed.
coord_fnc = function(x=input$ycol) {
  ylim = dplyr::case_when(
      x=="Bill Length (mm)" ~ c(30,60),
      x=="Flipper Length(mm)" ~ c(170, 232),
      x=="Bill Depth (mm)" ~ c(12.5,21.5)
  )
  coord_cartesian(ylim=ylim)
}


ggplot(data, aes(x = data[[input$xcol]], y = data[[input$ycol]], fill = Island)) +
  geom_boxplot(na.rm = TRUE) +
  coord_fnc() +
  xlab(input$xcol) +
  ylab(input$ycol) +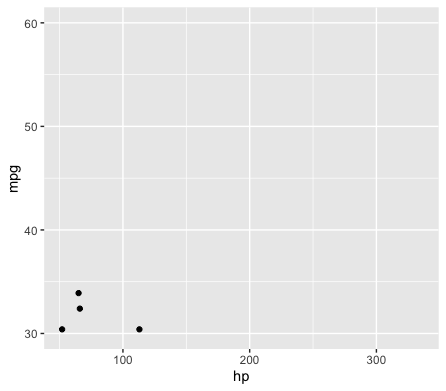
theme(text = element_text(size = 15))尝试使用内置的mtcars数据框架:
ggplot(mtcars, aes(hp, mpg)) +
  geom_point() +
  coord_fnc("Bill Length (mm)")
虽然if else语句的字符串需要大量代码,但这种方法可以工作,我不知道为什么会出现错误(可能是代码的其他部分)。例如,这起作用是:
input = list(ycol = "Year")

ggplot(mtcars, aes(hp, mpg)) +
  geom_point() +
  if (input$ycol == "Bill Length (mm)"){
    coord_cartesian(ylim = c(30, 60))
  } else if (input$ycol == "Bill Depth (mm)"){
    coord_cartesian(ylim = c(12.5, 21.5))
  } else if (input$ycol == "Flipper Length(mm)"){
    coord_cartesian(ylim = c(170, 232))
  } else if (input$ycol == "Body Mass (g)"){
    coord_cartesian(ylim = c(2500, 6500))
  } else if (input$ycol == "Year"){
    coord_cartesian(ylim = c(2006, 2009))
}https://stackoverflow.com/questions/65243530
复制相似问题
腾讯云开发者

Copyright © 2013 - 2026 Tencent Cloud. All Rights Reserved. 腾讯云 版权所有
深圳市腾讯计算机系统有限公司 ICP备案/许可证号:粤B2-20090059 ![]() 粤公网安备44030502008569号
粤公网安备44030502008569号
腾讯云计算(北京)有限责任公司 京ICP证150476号 | 京ICP备11018762号