
用ggplotly显示的堆叠条形图没有正确显示
用ggplotly显示的堆叠条形图没有正确显示
提问于 2020-12-08 12:57:14
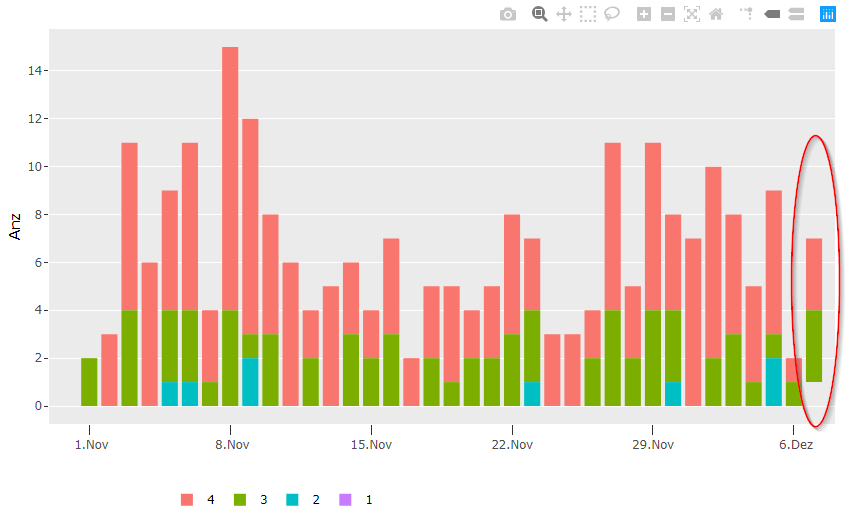
在我的堆叠条形图中有一个类别没有任何颜色,虽然它在图例中有正确的颜色。有人知道如何解决这个问题吗?它涉及“日期”=2020年-11-7和"Altersklassen_num“= 1。
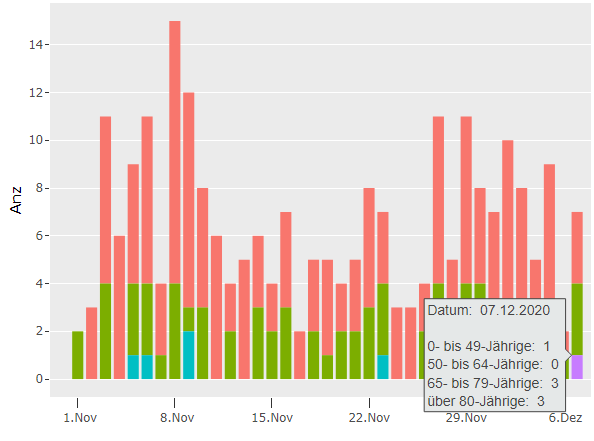
在短图(第一步)中,图形看上去非常好。另外,当我删除dynamicTicks (但之后x-scale变得非常混乱)。
我的数据
structure(list(date = structure(c(18567, 18568, 18569,
                                        18569, 18570, 18571, 18571, 18571, 18572, 18572, 18572, 18573,
                                        18573, 18574, 18574, 18575, 18575, 18575, 18576, 18576, 18577,
                                        18578, 18578, 18579, 18580, 18580, 18581, 18581, 18582, 18582,
                                        18583, 18584, 18584, 18585, 18585, 18586, 18586, 18587, 18587,
                                        18588, 18588, 18589, 18589, 18589, 18590, 18591, 18592, 18592,
                                        18593, 18593, 18594, 18594, 18595, 18595, 18596, 18596, 18596,
                                        18597, 18598, 18598, 18599, 18599, 18600, 18600, 18601, 18601,
                                        18601, 18602, 18602, 18603, 18603, 18603), class = "Date"), Altersklassen_num = structure(c(2L,
                                                                                                                                    1L, 1L, 2L, 1L, 1L, 2L, 3L, 1L, 2L, 3L, 1L, 2L, 1L, 2L, 1L, 2L,
                                                                                                                                    3L, 1L, 2L, 1L, 1L, 2L, 1L, 1L, 2L, 1L, 2L, 1L, 2L, 1L, 1L, 2L,
                                                                                                                                    1L, 2L, 1L, 2L, 1L, 2L, 1L, 2L, 1L, 2L, 3L, 1L, 1L, 1L, 2L, 1L,
                                                                                                                                    2L, 1L, 2L, 1L, 2L, 1L, 2L, 3L, 1L, 1L, 2L, 1L, 2L, 1L, 2L, 1L,
                                                                                                                                    2L, 3L, 1L, 2L, 1L, 2L, 4L), .Label = c("4", "3", "2", "1"), class = "factor"),
               Altersklasse1 = c(0, 0, 0, 0, 0, 0, 0, 0, 0, 0, 0, 0, 0,
                                 0, 0, 0, 0, 0, 0, 0, 0, 0, 0, 0, 0, 0, 0, 0, 0, 0, 0, 0,
                                 0, 0, 0, 0, 0, 0, 0, 0, 0, 0, 0, 0, 0, 0, 0, 0, 0, 0, 0,
                                 0, 0, 0, 0, 0, 0, 0, 0, 0, 0, 0, 0, 0, 0, 0, 0, 0, 0, 1,
                                 1, 1), Altersklasse2 = c(0, 0, 0, 0, 0, 1, 1, 1, 1, 1, 1,
                                                          0, 0, 0, 0, 2, 2, 2, 0, 0, 0, 0, 0, 0, 0, 0, 0, 0, 0, 0,
                                                          0, 0, 0, 0, 0, 0, 0, 0, 0, 0, 0, 1, 1, 1, 0, 0, 0, 0, 0,
                                                          0, 0, 0, 0, 0, 1, 1, 1, 0, 0, 0, 0, 0, 0, 0, 2, 2, 2, 0,
                                                          0, 0, 0, 0), Altersklasse3 = c(2, 0, 4, 4, 0, 3, 3, 3, 3,
                                                                                         3, 3, 1, 1, 4, 4, 1, 1, 1, 3, 3, 0, 2, 2, 0, 3, 3, 2, 2,
                                                                                         3, 3, 0, 2, 2, 1, 1, 2, 2, 2, 2, 3, 3, 3, 3, 3, 0, 0, 2,
                                                                                         2, 4, 4, 2, 2, 4, 4, 3, 3, 3, 0, 2, 2, 3, 3, 1, 1, 1, 1,
                                                                                         1, 1, 1, 3, 3, 3), Altersklasse4 = c(0, 3, 7, 7, 6, 5, 5,
                                                                                                                              5, 7, 7, 7, 3, 3, 11, 11, 9, 9, 9, 5, 5, 6, 2, 2, 5, 3, 3,
                                                                                                                              2, 2, 4, 4, 2, 3, 3, 4, 4, 2, 2, 3, 3, 5, 5, 3, 3, 3, 3,
                                                                                                                              3, 2, 2, 7, 7, 3, 3, 7, 7, 4, 4, 4, 7, 8, 8, 5, 5, 4, 4,
                                                                                                                              6, 6, 6, 1, 1, 3, 3, 3), Anz = c(2, 3, 7, 4, 6, 5, 3, 1,
                                                                                                                                                               7, 3, 1, 3, 1, 11, 4, 9, 1, 2, 5, 3, 6, 2, 2, 5, 3, 3, 2,
                                                                                                                                                               2, 4, 3, 2, 3, 2, 4, 1, 2, 2, 3, 2, 5, 3, 3, 3, 1, 3, 3,
                                                                                                                                                               2, 2, 7, 4, 3, 2, 7, 4, 4, 3, 1, 7, 8, 2, 5, 3, 4, 1, 6,
                                                                                                                                                               1, 2, 1, 1, 3, 3, 1)), row.names = c(NA, -72L), class = c("tbl_df",
                                                                                                                                                                                                                         "tbl", "data.frame"))
我的情节代码:
g.barchart<- ggplot(d.data_agg, aes(x= as.Date(date, "%Y-%m-%d"), y=Anz, fill=Altersklassen_num, text=paste("Datum: ", format(as.Date(date),"%d.%m.%Y"), "<br><br>0- bis 49-Jährige: ", Altersklasse1,"<br>50- bis 64-Jährige: ", Altersklasse2,"<br>65- bis 79-Jährige: ", Altersklasse3,"<br>über 80-Jährige: ", Altersklasse4))) +
  geom_bar(position="stack",stat="identity",width = 1.0)
g.barchart

fig <- ggplotly(g.barchart,tooltip = c("text"), dynamicTicks = TRUE) %>%
  style(hoverinfo = c("text")) %>%
  config(displayModeBar = T, locale = "de")  %>%
  layout(hoverlabel = list(align = "left", bgcolor = "#E5E8E8", font = list(size=14)),
         legend = list(orientation = "h", x = 0.15, y = -0.15),
         xaxis = list(showgrid = F, ticklen = 10,
                      tickval = NULL,
                      ticktext = NULL,
                      ticks = "outside",
                      tickmode = "array",
                      tickformat = '%e.%b',
                      ticktext = labels,
                      tickangle = 0,
                      title = "",
                      type = "date",
                      autorange = FALSE,
                      range = c(as.numeric(as.POSIXct("2020-10-30", format="%Y-%m-%d"))*1000,
                                as.numeric(as.POSIXct(k.DownDat, format="%Y-%m-%d"))*1000)),
         yaxis = list(autorange = FALSE))
fig回答 1
Stack Overflow用户
回答已采纳
发布于 2020-12-25 02:40:03
尝试对数据进行complete,然后运行ggplot。在此之后,如果您运行ggplotly,您将得到丢失的堆叠条。
d.data_agg <- d.data_agg %>% complete(date, nesting(Altersklassen_num), fill = list(Anz=0))
页面原文内容由Stack Overflow提供。腾讯云小微IT领域专用引擎提供翻译支持
原文链接:
https://stackoverflow.com/questions/65199392
复制相关文章
相似问题
腾讯云开发者

Copyright © 2013 - 2026 Tencent Cloud. All Rights Reserved. 腾讯云 版权所有
深圳市腾讯计算机系统有限公司 ICP备案/许可证号:粤B2-20090059 ![]() 粤公网安备44030502008569号
粤公网安备44030502008569号
腾讯云计算(北京)有限责任公司 京ICP证150476号 | 京ICP备11018762号