
如何生成热图
如何生成热图
提问于 2020-11-13 03:49:35
我正在练习热图编码,我是一个自学的人,我觉得自己被困在了注释,标签和颜色上。我想得到和这张照片一样的热图(很抱歉质量不好),所以我需要帮助:
图底部的-the点
数据在这个链接中
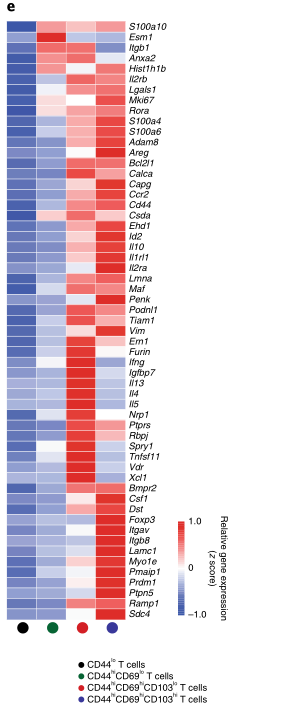
热图似乎是基于这四组的平均z得分,因为他们有两组,我想可能是团队生成了每两列的平均值,并从这四组的平均值推导出z-得分。我试过这段代码,但我觉得被卡住了:
library(dplyr)
library(tidyverse)
library(stringr)
library(matrixStats)
library(pheatmap)
library(heatmaps)

dfc <- read.csv(url("https://github.com/learnseq/learning/raw/main/GSE133399_Fig2_FPKM.csv"))

head(dfc)

dfg <- dfc %>% dplyr::filter(tracking_id %in% c(
    "Ifng", "Igfbp7", "Il13", "Il4", "Itgb1", "Rbpj",
    "Tnfsf11", "Xcl1", "Ern1", "Furin", "Il5", "Nrp1", "Ptprs",
    "Spry1", "Vdr", "Foxp3", "Prdm1", "Itgb8", "Lamc1", "Ptpn5",
    "Bmpr2", "Csf1", "Dst", "Myo1e", "Pmaip1", "Itgav", "Ramp1",
    "Sdc4", "Areg", "Calca", "Capg", "Ccr2", "Cd44", "Il10", "Il1rl1",
    "Maf", "Rora", "S100a4", "Adam8", "Adam19", "Anxa2", "Bcl2l1",
    "Csda", "Ehd1", "Hist1h1b", "Id2", "Il2ra", "Il2rb", "Lgals1",
    "Lmna", "Mki67", "Penk", "Podnl1", "S100a6", "Vim"))

dfg$CD44low_rep <- rowMeans(dfg[,c('CD44low_rep1', 'CD44low_rep2')], na.rm=TRUE)
dfg$CD44hi_CD69low_rep <- rowMeans(dfg[,c('CD44hi_CD69low_rep1', 'CD44hi_CD69low_rep2')], na.rm=TRUE)
dfg$CD44hi_CD69hi_CD103low_rep <- rowMeans(dfg[,c('CD44hi_CD69hi_CD103low_rep1', 'CD44hi_CD69hi_CD103low_rep2')], na.rm=TRUE)
dfg$CD44hi_CD69hi_CD103hi_rep <- rowMeans(dfg[,c('CD44hi_CD69hi_CD103hi_rep1', 'CD44hi_CD69hi_CD103hi_rep2')], na.rm=TRUE)
head(dfg)
dim(dfg)
head(dfg)
rownameshm <-paste(dfg[,1])
rownameshm
colnameshm <- paste(dQuote(colnames(dfg[0, 10:13])), collapse = ", ")
colnameshm
dfg$Mean <- rowMeans(dfg[,10:13])
dfg$sd <- rowSds(as.matrix(dfg[,10:13]))
head(dfg)

zScore <- function(p){
for(n in 10:13){
    p[[n]]=(as.numeric(p[[n]])-as.numeric(p[[14]]))/as.numeric(p[[15]])
    }
return(p)
}

Matrix_zScore <- t(apply(dfg,1,zScore))
head(Matrix_zScore)
Matrix_zScore_temp <- mapply(Matrix_zScore[,10:13], FUN=as.numeric)
Matrix_zScore_temp <- matrix(data=Matrix_zScore_temp, ncol=4, nrow=55)
Matrix_zScore_temp1<-as.data.frame(Matrix_zScore_temp)
head(Matrix_zScore_temp)
我的热图是这样的:
回答 1
Stack Overflow用户
回答已采纳
发布于 2020-11-13 09:13:03
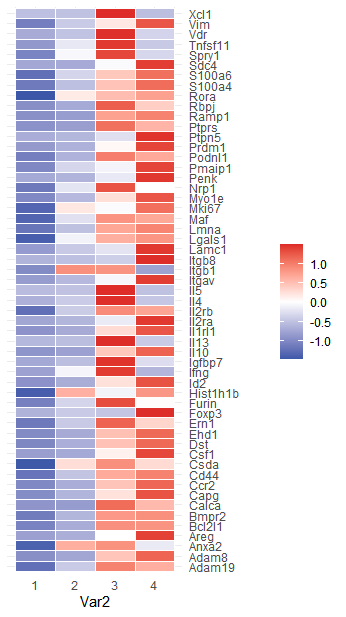
这里有一种方法可以让你更接近于使用ggplot:
library(ggplot2)

rownames(Matrix_zScore_temp) <- dfg$tracking_id
plot_frame <- reshape2::melt(Matrix_zScore_temp)

ggplot(plot_frame, aes(Var2, Var1, fill = value)) +
  geom_tile(color = "white") +
  scale_y_discrete(position = "right") +
  labs(y = "", fill = "") +
  scale_fill_gradientn(colors = c("#3C57A8", "white", "#DE2D29")) +
  theme_minimal()
页面原文内容由Stack Overflow提供。腾讯云小微IT领域专用引擎提供翻译支持
原文链接:
https://stackoverflow.com/questions/64815219
复制相关文章
相似问题
腾讯云开发者

Copyright © 2013 - 2026 Tencent Cloud. All Rights Reserved. 腾讯云 版权所有
深圳市腾讯计算机系统有限公司 ICP备案/许可证号:粤B2-20090059 ![]() 粤公网安备44030502008569号
粤公网安备44030502008569号
腾讯云计算(北京)有限责任公司 京ICP证150476号 | 京ICP备11018762号