
X阵列:具有低顶轴坐标变换的极pcolormesh
我试图绘制一个二维的x数组DataArray,表示在极坐标中参数化的变量。重要:theta坐标是度,而不是弧度。下面的代码段创建一个示例数据集:
import numpy as np
import xarray as xr

res_theta = 20
thetas = np.arange(0, 360, res_theta)
res_r = 0.1
rs = np.arange(0, 1, res_r)
data = np.random.random((len(thetas), len(rs)))
my_da = xr.DataArray(
    data,
    coords=(thetas, rs),
    dims=("theta", "r"),
)我想把这些数据绘制成一个极地pcolormesh。我还希望依赖xarray的绘图例程,以从尽可能多的功能(面面化、绘图定制等)中获益。Matplotlib的极坐标投影假设theta角度是以弧度表示的:如果我采用简单的解决方案,我首先必须将theta坐标转换为弧度,但我不想就地修改数组。我还没有找到比复制数组和转换副本的theta更好的方法,例如:
def pcolormesh_polar_expensive(da, *args, **kwargs):
da_tmp = da.copy() # I'd like to avoid that
# Get x value
try:
x = args[0]
except IndexError:
x = da_tmp.dims[0]
da_tmp[x] = np.deg2rad(da_tmp[x])
try:
subplot_kws = kwargs["subplot_kws"]
except KeyError:
subplot_kws = {}
return da_tmp.plot.pcolormesh(
*args,
subplot_kws=dict(projection="polar"),
**kwargs
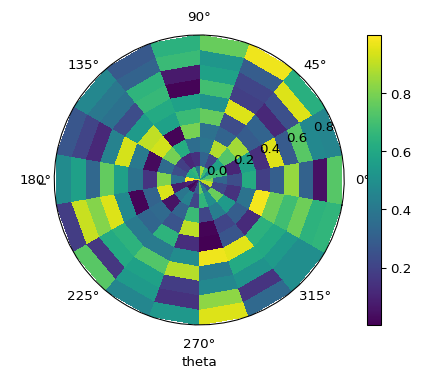
)这就产生了所需的情节:
pcolormesh_polar_expensive(my_da, "theta", "r")
实际问题
不过,我希望避免重复数据:我的实际数据集要大得多。我做了一些研究,发现了Matplotlib的转换管道,我觉得我可以用它来动态地插入这个转换在绘图例程中,但是到目前为止,我还没有得到任何能正常工作的东西。有人知道我该怎么做吗?
回答 1
Stack Overflow用户
发布于 2020-11-08 19:41:03
多亏了@kmuehlbauer的建议和对xarray.DataArray.assign_coords() docs的仔细研究,我才成功地实现了我想要的结果。
首先,我修改了测试数据,使其还包括单元元数据:
import numpy as np
import xarray as xr
import pint

ureg = pint.UnitRegistry()

res_r = 0.1
rs = np.arange(0, 1, res_r)
res_theta = 20
thetas = np.arange(0, 360, res_theta)
data = np.random.random((len(rs), len(thetas)))
my_da = xr.DataArray(
    data,
    coords=(rs, thetas),
    dims=("r", "theta"),
)
my_da.theta.attrs["units"] = "deg"然后,我改进了kwargs处理,使单元转换自动化,并创建了与theta维度关联的额外坐标:
def pcolormesh_polar_cheap(da, r=None, theta=None, add_labels=False, **kwargs):
    if r is None:
        r = da.dims[0]
    if theta is None:
        theta = da.dims[1]

    try:
        theta_units = ureg.Unit(da[theta].attrs["units"])
    except KeyError:
        theta_units = ureg.rad

    if theta_units != ureg.rad:
        theta_rad = f"{theta}_rad"
        theta_rad_values = ureg.Quantity(da[theta].values, theta_units).to(ureg.rad).magnitude
        da_plot = da.assign_coords(**{theta_rad: (theta, theta_rad_values)})
        da_plot[theta_rad].attrs = da[theta].attrs
        da_plot[theta_rad].attrs["units"] = "rad"
    else:
        theta_rad = theta
        da_plot = da

    kwargs["x"] = theta_rad
    kwargs["y"] = r
    kwargs["add_labels"] = add_labels

    try:
        subplot_kws = kwargs["subplot_kws"]
    except KeyError:
        subplot_kws = {}
    subplot_kws["projection"] = "polar"

    return da_plot.plot.pcolormesh(
        **kwargs,
        subplot_kws=subplot_kws,
)这里非常重要的一点是,assign_coords()返回从它调用的数据数组的副本,这个副本的值实际上引用了原始数组,因此除了创建额外的坐标之外,没有增加内存开销。按照@kmuehlbauer的建议,就地修改数据数组很简单(只需将da_plot = da.assign_coords(...)替换为da = da.assign_coords(...))。
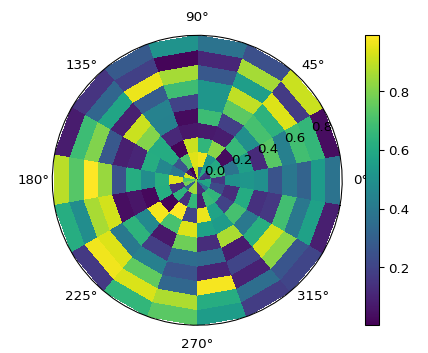
然后我们得到相同的图(没有轴标签,因为我更改了默认值以便隐藏它们):
pcolormesh_polar_cheap(my_da, r="r", theta="theta")
https://stackoverflow.com/questions/64664428
复制相似问题
腾讯云开发者

Copyright © 2013 - 2026 Tencent Cloud. All Rights Reserved. 腾讯云 版权所有
深圳市腾讯计算机系统有限公司 ICP备案/许可证号:粤B2-20090059 ![]() 粤公网安备44030502008569号
粤公网安备44030502008569号
腾讯云计算(北京)有限责任公司 京ICP证150476号 | 京ICP备11018762号