
如何绘制应用滑动窗口后共享相同日期时间的子图?
如何绘制应用滑动窗口后共享相同日期时间的子图?
提问于 2020-09-29 04:13:43
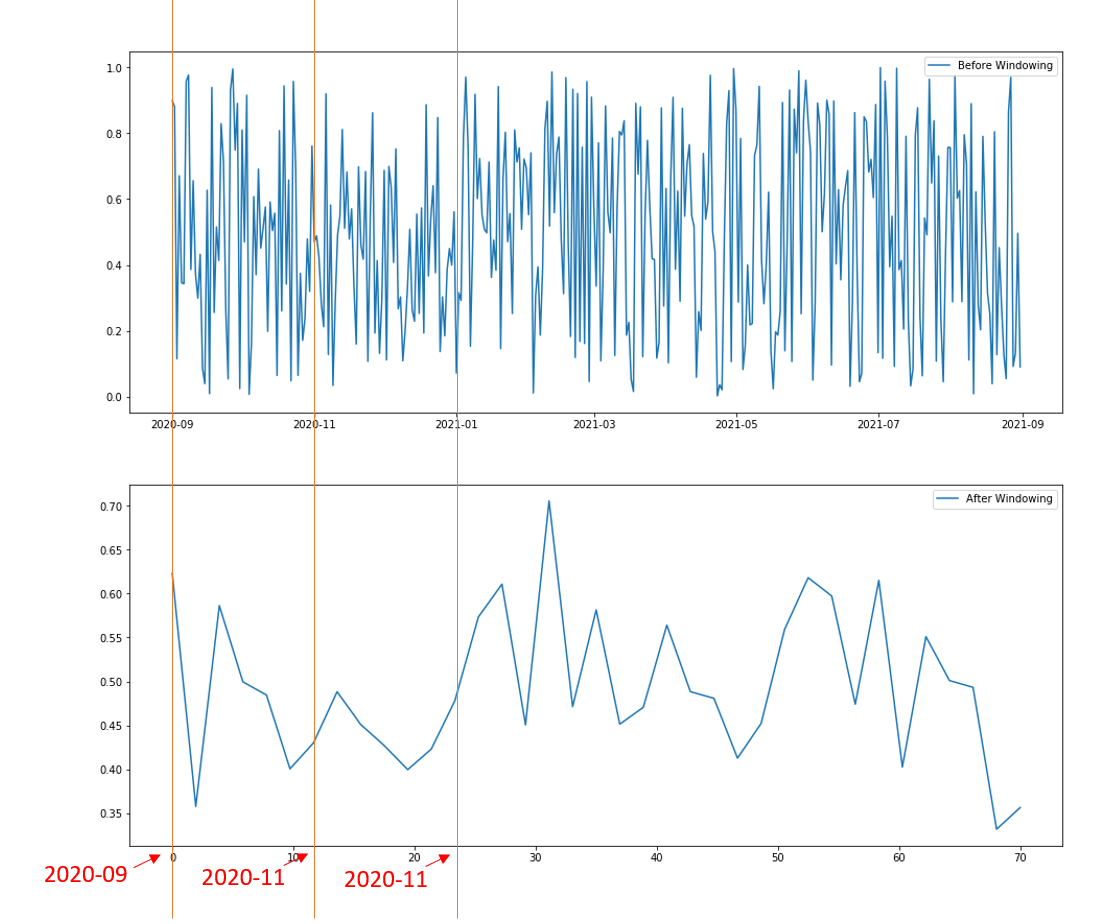
在执行滑动窗口以平滑绘图后,我很难让我的子图共享相同的x轴(日期时间)。我希望窗口后的日期时间与窗口前的日期时间共享,如下图所示。我还附上了代码,以复制下面的情节。
from random import random
from datetime import datetime, timedelta
import matplotlib.pyplot as plt
import pandas as pd
import numpy as np

# Creating dummy datasets for illustration
date_example = []
for i in range (0, 365):
    date_example.append(datetime(2020, 9, 1)+ timedelta(days = i))

values = []
for _ in range (365):
    value = random()
    values.append(value)

date_example = pd.DataFrame(date_example)
values = pd.DataFrame(values)
example_set = pd.concat([date_example, values], axis =1, ignore_index=True)

# Creating sliding window on values dataset
wLen = 10
values_windowed = [values[i*wLen : (i+1)*wLen] for i in range((len(values)+ wLen - 1)//wLen)]

values_windowed_mean = np.zeros((len(values_windowed)))
for i in range(0,len(values_windowed)):
    values_windowed_mean[i] = np.mean(values_windowed[i])

# Plotting the plots
fig, ax = plt.subplots(2, figsize = (16,14))
ax[0].plot(date_example, values, label='Before Windowing')
ax[1].plot(np.linspace(0,70,num=len(values_windowed_mean), endpoint=True), values_windowed_mean, label='After Windowing')
ax[0].legend()
ax[1].legend()
plt.show()回答 2
Stack Overflow用户
回答已采纳
发布于 2020-09-29 04:46:29
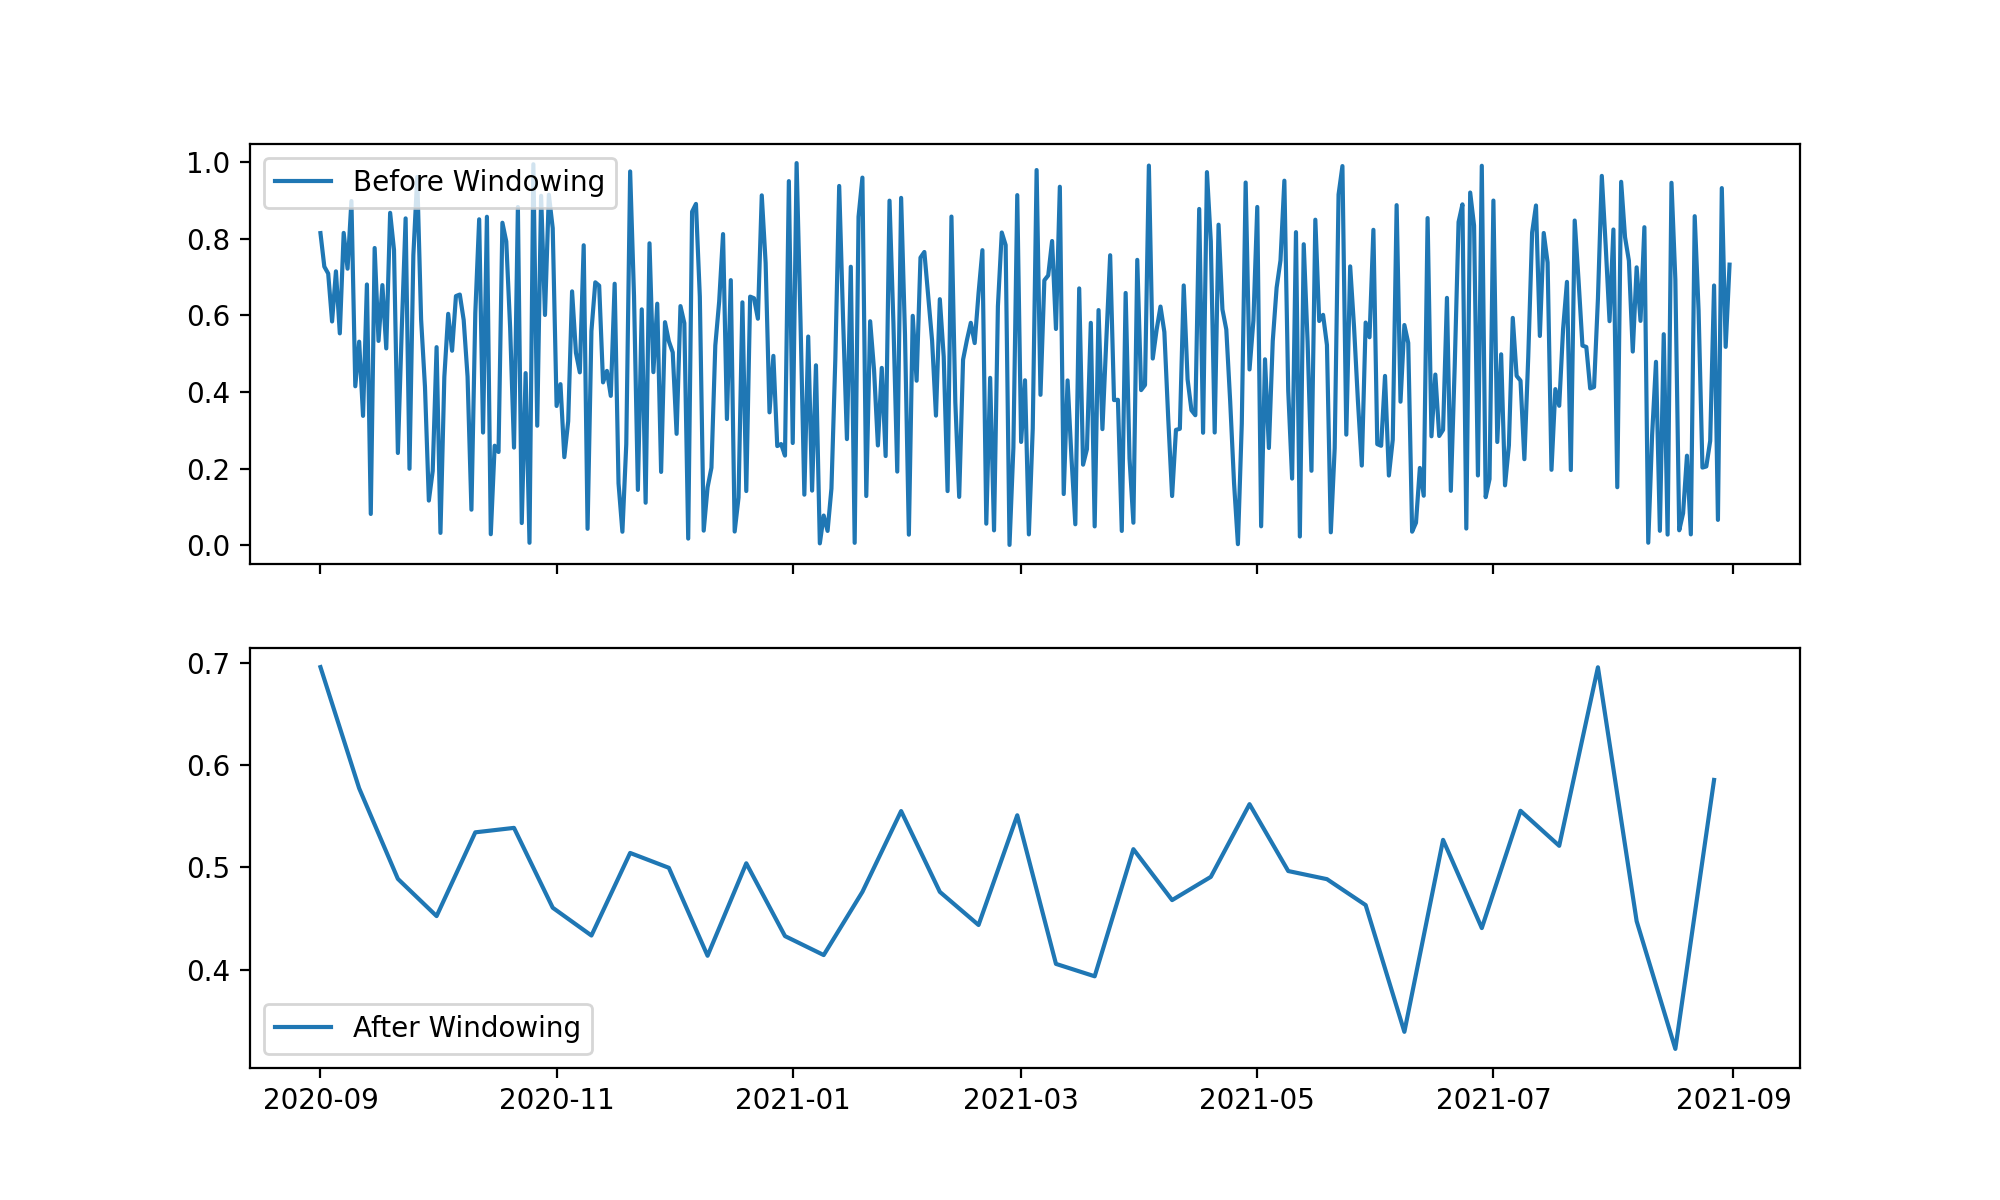
您要寻找的是sharex 选项。在创建子图时,可以指定sharex=True来链接两个子图的x轴。另外,您应该使用来自第一个数据集(非加窗口的)的相同的时态值,并进行下采样。
下面是您的代码的最后一部分,以及下面的输出。
# Create two subplots with shared xaxis
fig, ax = plt.subplots(2, figsize = (16,14), sharex=True)

# Plot two time series with same temporal vector
ax[0].plot(date_example, values, label='Before Windowing')
ax[1].plot(example_set[0].iloc[::wLen], values_windowed_mean, label='After Windowing')

# Cosmetics & show
ax[0].legend()
ax[1].legend()
plt.show()
Stack Overflow用户
发布于 2020-09-29 04:32:15
既然您有Pandas example_set,为什么不使用它:
# Plotting the plots
fig, ax = plt.subplots(2, figsize = (16,14))

# change `0` in `example[0]` to the name of date column
# change `1` in `example[1]` to the name of the value column
ax[0].plot(example_set[0], example_set[1], label='Before Windowing')
ax[1].plot(example_set[0].iloc[::wLen], values_windowed_mean, label='After Windowing')
ax[0].legend()
ax[1].legend()
输出:

页面原文内容由Stack Overflow提供。腾讯云小微IT领域专用引擎提供翻译支持
原文链接:
https://stackoverflow.com/questions/64112797
复制相关文章
相似问题
腾讯云开发者

Copyright © 2013 - 2026 Tencent Cloud. All Rights Reserved. 腾讯云 版权所有
深圳市腾讯计算机系统有限公司 ICP备案/许可证号:粤B2-20090059 ![]() 粤公网安备44030502008569号
粤公网安备44030502008569号
腾讯云计算(北京)有限责任公司 京ICP证150476号 | 京ICP备11018762号