
R如何用3个变量和一个4级因子来标记ggbox图()中的均值?(尝试显示)
R如何用3个变量和一个4级因子来标记ggbox图()中的均值?(尝试显示)
提问于 2020-09-26 21:25:07
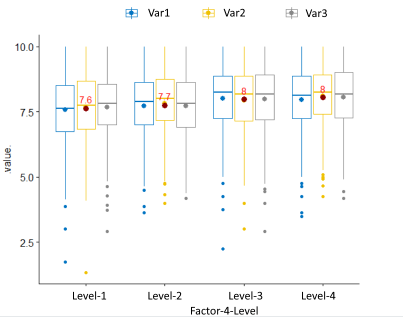
这种标记均值的尝试会导致每个组得到一个标签的中间值。
ggboxplot(DataW, x = "Factor-r-Level", y = c("Var1","Var2","Var2"),
merge = TRUE, palette = "jco", add="mean") +
stat_summary(fun.y=mean, colour="darkred", geom="point", hape=18,
size=3,show_guide = FALSE) + stat_summary(fun.y=mean, colour="red",
geom="text", show_guide = FALSE, vjust=-0.7, aes( label=round(..y.., digits=1)))
数据的格式如下:
> head(DataW)
# A tibble: 6 x 4
  Factor-4-Level      Var1           Var2              Var3
  <chr>              <dbl>          <dbl>             <dbl>
1 Level-1             7.75           8.08              8.82
2 Level-3             6.62           6                 5.36
3 Level-2             7.12           7.17              7.18
4 Level-3             7.5            7.83              7.73
5 Level-4             6.12           8                 7.45
6 Level-4             8.25           8.08              7
我想使用ggboxplot(),并且我希望三组可视地组合在一起,就像它们一样。
谢谢你的帮助。
回答 1
Stack Overflow用户
回答已采纳
发布于 2020-09-26 21:56:13
这里没有足够的数据来制作一个可重复的示例,所以下面是数据集的粗略近似:
library(ggplot2)
library(dplyr)
library(tidyr)

set.seed(69)

DataW <- tibble(`Factor-4-Level` = paste0("Level-", sample(4, 200, TRUE)),
                 Var1 = rnorm(200, 7, 2),
                 Var2 = rnorm(200, 7.5, 1.8),
                 Var3 = rnorm(200, 8, 2.1))

head(DataW)
#> # A tibble: 6 x 4
#>   `Factor-4-Level`  Var1  Var2  Var3
#>   <chr>            <dbl> <dbl> <dbl>
#> 1 Level-4          11.4   6.27  6.76
#> 2 Level-1          10.2   6.91 11.0
#> 3 Level-3           8.71  5.82  8.27
#> 4 Level-2           8.61  6.79  9.24
#> 5 Level-4           4.70  7.78  9.76
#> 6 Level-4 7.20 6.31 7.22如果您坚持使用ggboxplot,则需要映射文本并指向Var1、Var2、Var3分组变量,以便可以使用position_dodge正确地定位它们。不幸的是,ggboxplot不允许您指定这个变量的名称,但是一些检测工作表明,在由ggboxplot生成的ggplot对象中,相关的分组变量被称为.y.,因此您可以这样做:
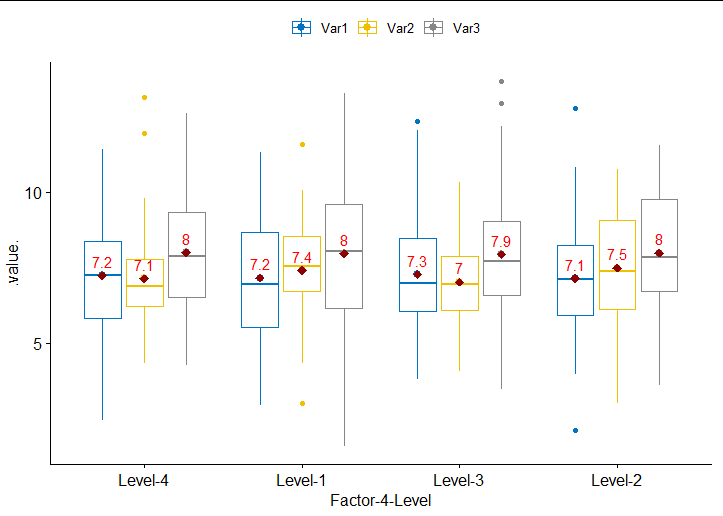
library(ggpubr)

ggboxplot(DataW, x = "Factor-4-Level", y = c("Var1", "Var2", "Var3"),
          merge = TRUE, palette = "jco", add = "mean") +
  stat_summary(fun = mean, geom = "point", shape = 18, size = 3,
               aes(group = .y.), color = "darkred",
               position = position_dodge(width = 0.8)) +
  stat_summary(fun = mean, colour = "red",
               position = position_dodge(width = 0.8),
               geom = "text", vjust = -0.7,
               aes(label = round(..y.., digits = 1), group = .y.))
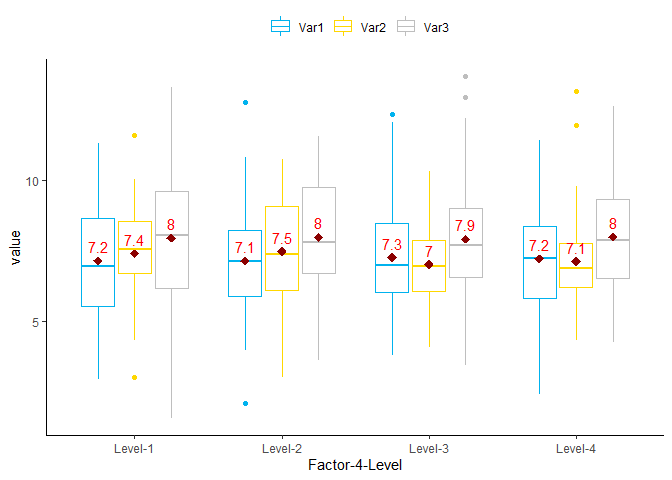
顺便说一句,如果您想要轻松地添加自定义美学映射,那么使用ggplot本身获得相同的绘图实际上非常容易:
DataW %>%
  pivot_longer(-1) %>%
  ggplot(aes(`Factor-4-Level`, value, color = name)) +
  geom_boxplot() +
  stat_summary(fun = mean, geom = "point", shape = 18, size = 3,
               aes(group = name), color = "darkred",
               position = position_dodge(width = 0.75)) +
  stat_summary(fun = mean, colour = "red",
               position = position_dodge(width = 0.75),
               geom = "text", vjust = -0.7,
               aes(label = round(..y.., digits = 1), group = name)) +
  scale_color_manual(values = c("deepskyblue2", "gold", "gray"), name = "") +
  theme_classic() +
  theme(legend.position = "top") +
页面原文内容由Stack Overflow提供。腾讯云小微IT领域专用引擎提供翻译支持
原文链接:
https://stackoverflow.com/questions/64082648
复制相关文章
相似问题
腾讯云开发者

Copyright © 2013 - 2026 Tencent Cloud. All Rights Reserved. 腾讯云 版权所有
深圳市腾讯计算机系统有限公司 ICP备案/许可证号:粤B2-20090059 ![]() 粤公网安备44030502008569号
粤公网安备44030502008569号
腾讯云计算(北京)有限责任公司 京ICP证150476号 | 京ICP备11018762号