
光泽:动态高程调整图
光泽:动态高程调整图
提问于 2020-08-28 13:24:15
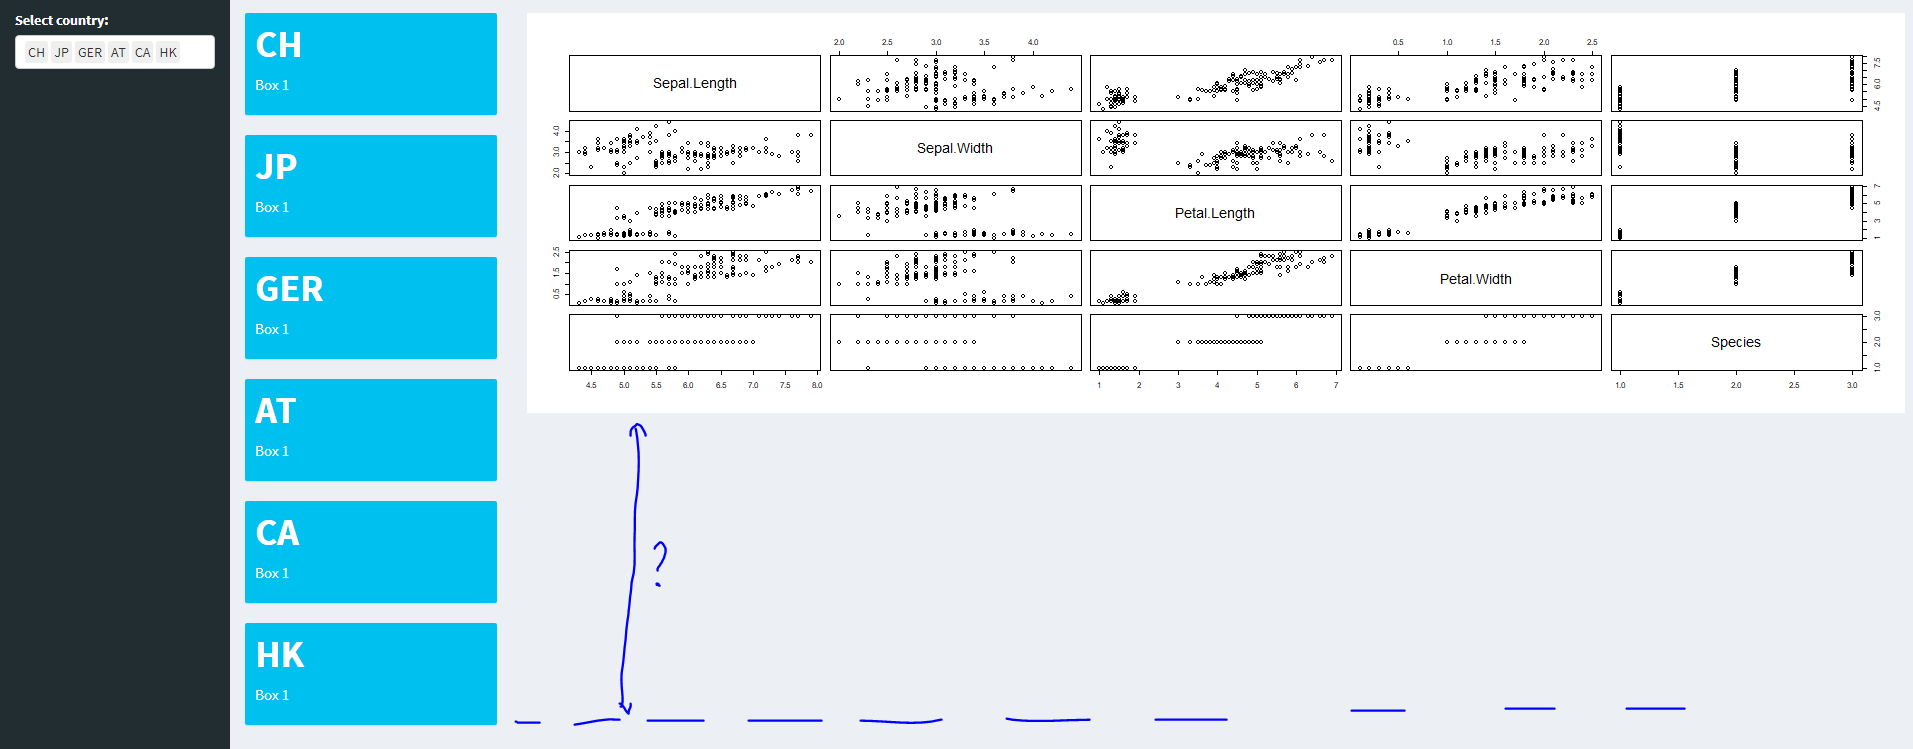
问题:在belows闪亮的应用程序中,用户可以根据选择的输入添加值框中的信息。如果用户选择了所有可能的选择,那么UI看起来就像截图中的一样。
问题:是否可能使绘图(与值框位于同一行)调整高度(因此,图的底部与最后一个值框的底部对齐)?
library(shiny)
library(shinydashboard)

ui <- dashboardPage(
  dashboardHeader(),

  dashboardSidebar(
    selectizeInput(
      inputId = "select",
      label = "Select country:",
      choices = c("CH", "JP", "GER", "AT", "CA", "HK"),
      multiple = TRUE)
  ),

  dashboardBody(
    fluidRow(column(2, uiOutput("ui1")),
             column(10, plotOutput("some_plot"))))#,
                # column(4, uiOutput("ui2")),
                # column(4, uiOutput("ui3")))
)

server <- function(input, output) {

  output$ui1 <- renderUI({
    req(input$select)

    lapply(seq_along(input$select), function(i) {
      fluidRow(
        valueBox(value = input$select[i],
                 subtitle = "Box 1",
                 width = 12)
      )
    })
  })

  output$some_plot <- renderPlot(
    plot(iris)
  )
}

shinyApp(ui = ui, server = server)回答 2
Stack Overflow用户
回答已采纳
发布于 2020-08-31 22:58:43
您可以调整renderPlot中的高度。我已将最小值设置为3值框高度。因此,在添加了3个值框之后,它就开始增加高度。您可以根据需要修改它。试试下面的代码。
  library(shiny)
  library(shinydashboard)

  ui <- dashboardPage(
    dashboardHeader(),

    dashboardSidebar(
      selectizeInput(
        inputId = "select",
        label = "Select country:",
        choices = c("CH", "JP", "GER", "AT", "CA", "HK"),
        multiple = TRUE)
    ),

    dashboardBody(
      fluidRow(column(2, uiOutput("ui1")),
               column(10, plotOutput("some_plot"))))#,

    # column(4, uiOutput("ui2")),
    # column(4, uiOutput("ui3")))
  )

  server <- function(input, output) {
    plotht <- reactiveVal(360)
    observe({
      req(input$select)
      nvbox <- length(input$select)
      if (nvbox > 3) {
        plotheight <- 360 + (nvbox-3)*120
      }else plotheight <- 360
      plotht(plotheight)
    })

    output$ui1 <- renderUI({
      req(input$select)

      lapply(seq_along(input$select), function(i) {
        fluidRow(
          valueBox(value = input$select[i],
                   subtitle = "Box 1",
                   width = 12)
        )
      })
    })

    observe({
      output$some_plot <- renderPlot({
        plot(iris)
      }, height=plotht())
    })


  }

shinyApp(ui = ui, server = server)Stack Overflow用户
发布于 2021-05-27 07:56:26
这是我的尝试,基于this answer。这使用窗口大小侦听器动态调整绘图的大小(可能通过在inline = TRUE调用中使用plotOutput )。外部容器的宽度是固定的,所以可以直接引用,但是高度是动态的,所以我的解决办法是使用窗口高度并减去50个像素。这似乎是可行的,只要有一个单一的情节元素,而侧边栏还没有调整到顶部的情节,而不是在它旁边。
在半秒内没有更改后,窗口大小将被取消为仅调整大小,这样服务器在重绘调用时就不会被征税太多。如果尚未确定维度,代码也不会绘制任何内容,这样就不会有初始的绘图闪烁。
library(shiny)

ui <- fluidPage(
    ## Add a listener for the window height and plot container width
    tags$head(tags$script('
                        var winDims = [0, 0];
                        var plotElt = document;
                        $(document).on("shiny:connected", function(e) {
                            plotElt = document.getElementById("plotContainer");
                            winDims[0] = plotElt.clientWidth;
                            winDims[1] = window.innerHeight;
                            Shiny.onInputChange("winDims", winDims);
                        });
                        $(window).resize(function(e) {
                            winDims[0] = plotElt.clientWidth;
                            winDims[1] = window.innerHeight;
                            Shiny.onInputChange("winDims", winDims);
                        });
                    ')),
    titlePanel("Old Faithful Geyser Data"),
    sidebarLayout(
        sidebarPanel(
            sliderInput("bins",
                        "Number of bins:",
                        min = 1,
                        max = 50,
                        value = 30),
            sliderInput("height", label="Height",
                        min=100, max=900, value = 600)
        ),
        mainPanel(
            tags$div(id="plotContainer", ## Add outer container to make JS constant
                     ## Use an "inline" plot, so that width and height can be set server-side
                     plotOutput("distPlot", inline = TRUE))
        )
    )
)

server <- function(input, output) {
    ## reduce the amount of redraws on window resize
    winDims_d <- reactive(input$winDims) %>% debounce(500)
    ## fetch the changed window dimensions
    getWinX <- function(){
        print(input$winDims);
        if(is.null(winDims_d())) { 400 } else {
            return(winDims_d()[1])
        }
    }
    getWinY <- function(){
        if(is.null(winDims_d())) { 600 } else {
            return(winDims_d()[2] - 50)
        }
    }
    output$distPlot <- renderPlot({
        if(is.null(winDims_d())){
            ## Don't plot anything if we don't yet know the size
            return(NULL);
        }
        x    <- faithful[, 2]
        bins <- seq(min(x), max(x), length.out = input$bins + 1)
        hist(x, breaks = bins, col = 'darkgray', border = 'white')
    }, width = getWinX, height=getWinY)
}

shinyApp(ui = ui, server = server)页面原文内容由Stack Overflow提供。腾讯云小微IT领域专用引擎提供翻译支持
原文链接:
https://stackoverflow.com/questions/63634653
复制相关文章
相似问题
腾讯云开发者

Copyright © 2013 - 2026 Tencent Cloud. All Rights Reserved. 腾讯云 版权所有
深圳市腾讯计算机系统有限公司 ICP备案/许可证号:粤B2-20090059 ![]() 粤公网安备44030502008569号
粤公网安备44030502008569号
腾讯云计算(北京)有限责任公司 京ICP证150476号 | 京ICP备11018762号