
使用“外挂字体”和“牛仔字体”:字体宽度未知的字符错误
使用“外挂字体”和“牛仔字体”:字体宽度未知的字符错误
提问于 2020-08-23 15:17:43
我试图在ggplot中使用一种只能通过extrafont包的字体。然后,当我想使用cowplot包组合多个绘图时,总是会出现大量的错误:
46: In grid.Call(C_textBounds, as.graphicsAnnot(x$label),  ... :
  font width unknown for character 0x65
47: In grid.Call(C_textBounds, as.graphicsAnnot(x$label),  ... :
  font width unknown for character 0x63
48: In grid.Call(C_textBounds, as.graphicsAnnot(x$label),  ... :
  font width unknown for character 0x69
49: In grid.Call(C_textBounds, as.graphicsAnnot(x$label),  ... :
  font width unknown for character 0x65
50: In grid.Call(C_textBounds, as.graphicsAnnot(x$label),  ... :
font width unknown for character 0x73,注意,,包实际上产生输出(也就是并排的情节),但是错误信息让我担心。
到目前为止我尝试过的是:
使用extrafont::font_install()
- Loading安装字体的
- 使用
extrafont::loadfonts()
安装字体
我安装了extrafont和extrafontdb以及cowplot。
这里是我使用的一个例子:
library(tidyverse)
library(extrafont)
library(cowplot)
library(palmerpenguins)
data(penguins)
penguins %>%
select(year, flipper_length_mm,species) %>%
ggplot(aes(x=year,y=flipper_length_mm,fill=species)) +
geom_col() +
labs(title = "First Plot") +
theme(text = element_text(family = "Georgia")) -> plot1
penguins %>%
select(year, bill_length_mm,species) %>%
ggplot(aes(x=year,y=bill_length_mm,fill=species)) +
geom_col() +
labs(title = "Second Plot") +
theme(text = element_text(family = "Georgia")) -> plot2
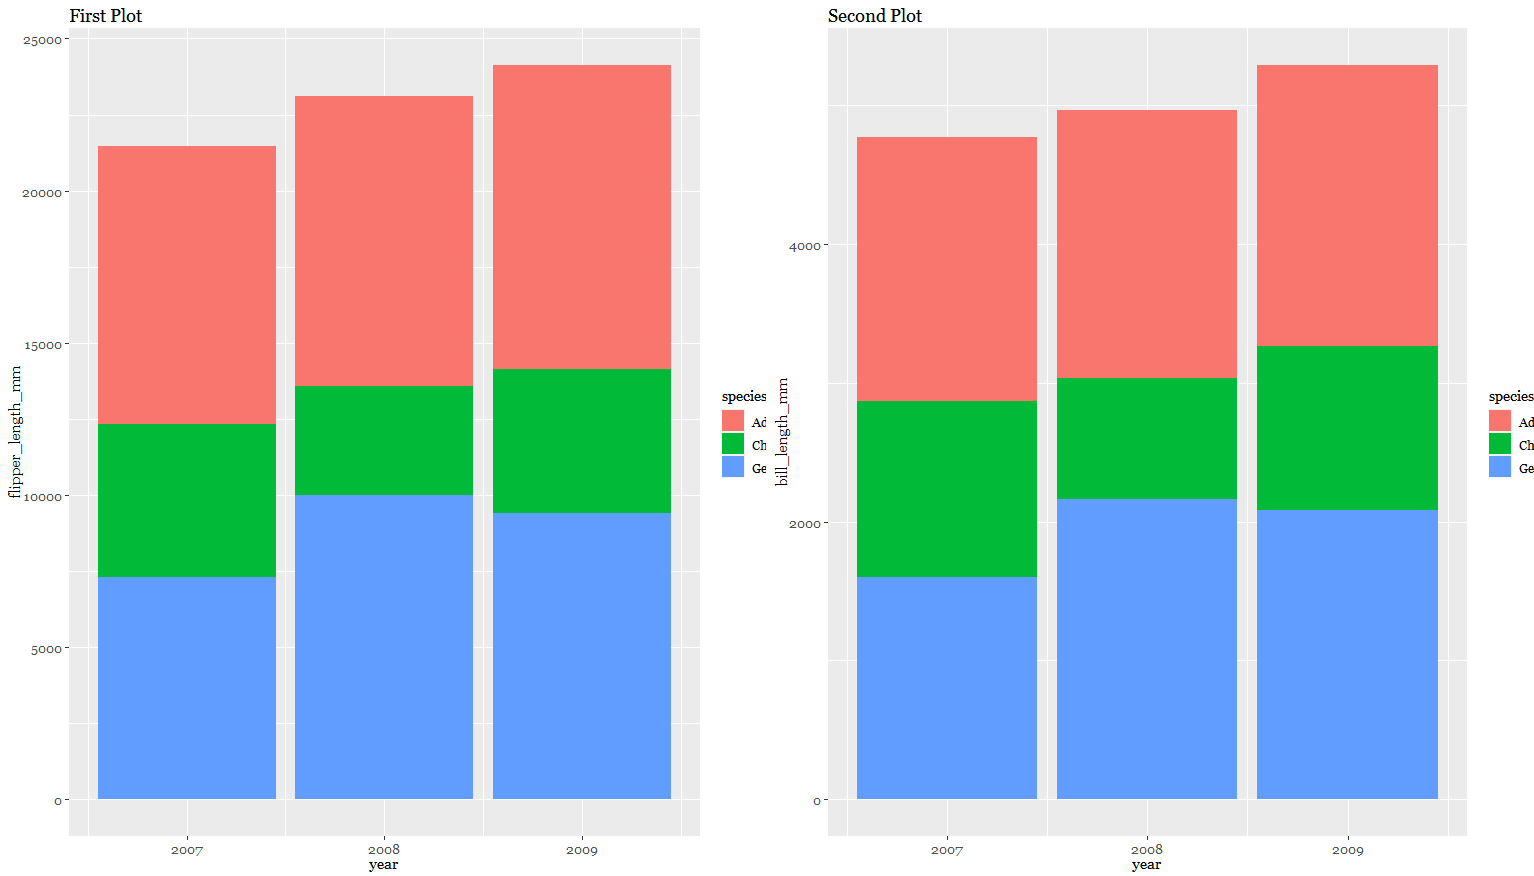
cowplot::plot_grid(plot1,plot2)
回答 1
Stack Overflow用户
回答已采纳
发布于 2020-09-20 23:38:21
谢谢克劳斯·威尔克在评论中的回答:
设置空设备是必要的。您可能需要安装开发版本才能完全正常工作(对我来说确实很好!)
简短的答案是:
set_null_device(cairo_pdf)
cowplot::plot_grid(plot1,plot2)错误信息就消失了。使用set_null_device("png")也对我有效,但考虑到我的目标是保存PDF,根据Claus的说法,这是更安全的选择。
全文:
library(tidyverse)
library(extrafont)
library(cowplot)
library(palmerpenguins)
data(penguins)


penguins %>%
  select(year, flipper_length_mm,species) %>%
  ggplot(aes(x=year,y=flipper_length_mm,fill=species)) +
  geom_col() +
  labs(title = "First Plot") +
  theme(text = element_text(family = "Georgia")) -> plot1


penguins %>%
  select(year, bill_length_mm,species) %>%
  ggplot(aes(x=year,y=bill_length_mm,fill=species)) +
  geom_col() +
  labs(title = "Second Plot") +
  theme(text = element_text(family = "Georgia")) -> plot2


set_null_device(cairo_pdf)
cowplot::plot_grid(plot1,plot2)页面原文内容由Stack Overflow提供。腾讯云小微IT领域专用引擎提供翻译支持
原文链接:
https://stackoverflow.com/questions/63548647
复制相关文章
相似问题
腾讯云开发者

Copyright © 2013 - 2026 Tencent Cloud. All Rights Reserved. 腾讯云 版权所有
深圳市腾讯计算机系统有限公司 ICP备案/许可证号:粤B2-20090059 ![]() 粤公网安备44030502008569号
粤公网安备44030502008569号
腾讯云计算(北京)有限责任公司 京ICP证150476号 | 京ICP备11018762号