
R: Ggplot2错误:美学必须是长度1或与数据(72)相同:填充
R: Ggplot2错误:美学必须是长度1或与数据(72)相同:填充
提问于 2020-07-29 18:46:24
我正在努力为威斯康星州的人口建立一个分区。
library(broom)
library(sf)
library(ggplot2)
library(rayshader)
library(viridis)
library(tidyverse)

#Population CSV
population = read_csv("co-est2019-annres-55.csv")

#Import Shapefile
Wi_counties <- st_read(
  "County_Boundaries_24K.shp")

#Plot Shapefile
ggplot() +
  geom_sf(data = Wi_counties, size = 1, color = "black", fill = "cyan1") +
  ggtitle("WI_Counties") +
  coord_sf()

gg_wi = ggplot(Wi_counties) +
  geom_sf(aes(fill = population)) +
  scale_fill_viridis("population") +
  ggtitle("Population by County in Wisconsin") +
  theme_bw()

plot_gg(gg_wi, multicore = TRUE, width = 6 ,height=2.7, fov = 70)
但是正在得到这个错误:错误:美学必须是长度1或与数据(72):fill相同。
这里的数据https://www.dropbox.com/sh/8zjwt55yg4x1o2h/AADBDuTcIhym9tlrx9JkfVhoa?dl=0
回答 2
Stack Overflow用户
回答已采纳
发布于 2020-07-29 21:26:43
您的代码有几个问题:
在fill
- As上映射数据格式( dataframe,
population)的
- --您的数据没有标题--您必须在
read_csv - You中设置
col_names = FALSE,必须加入shapefile,而数据必须使用population数据。否则,就不能保证将人口规模映射到正确的县。 - ,即使在解决这些问题时,
plot_gg也会抛出一个与theme_bw相关的错误Error in if (whichtype %in% c("text", "line")) { : argument is of length zero。有关最后一个问题的解决方案,请参阅here.
要解决前三个问题,请使用col_names = FALSE或命名cols,就像我在下面的代码中所做的那样。第二。去掉县名中添加的County。第三。按县加入shapefile和人口数据。第四,在fill上绘制人口规模图。试试这个:
library(sf)
library(ggplot2)
library(viridis)
library(readr)
library(rayshader)
library(dplyr)
#Population CSV
population = read_csv(here::here("Wisconsin/co-est2019-annres-55.csv"), col_names = c("county", "pop")) %>%
mutate(county = gsub("\\sCounty", "", county))
#Import Shapefile
Wi_counties <- st_read(here::here("Wisconsin/County_Boundaries_24K.shp"))
Wi_counties_join <- Wi_counties %>%
left_join(population, by = c("COUNTY_NAM" = "county"))
#Plot Shapefile
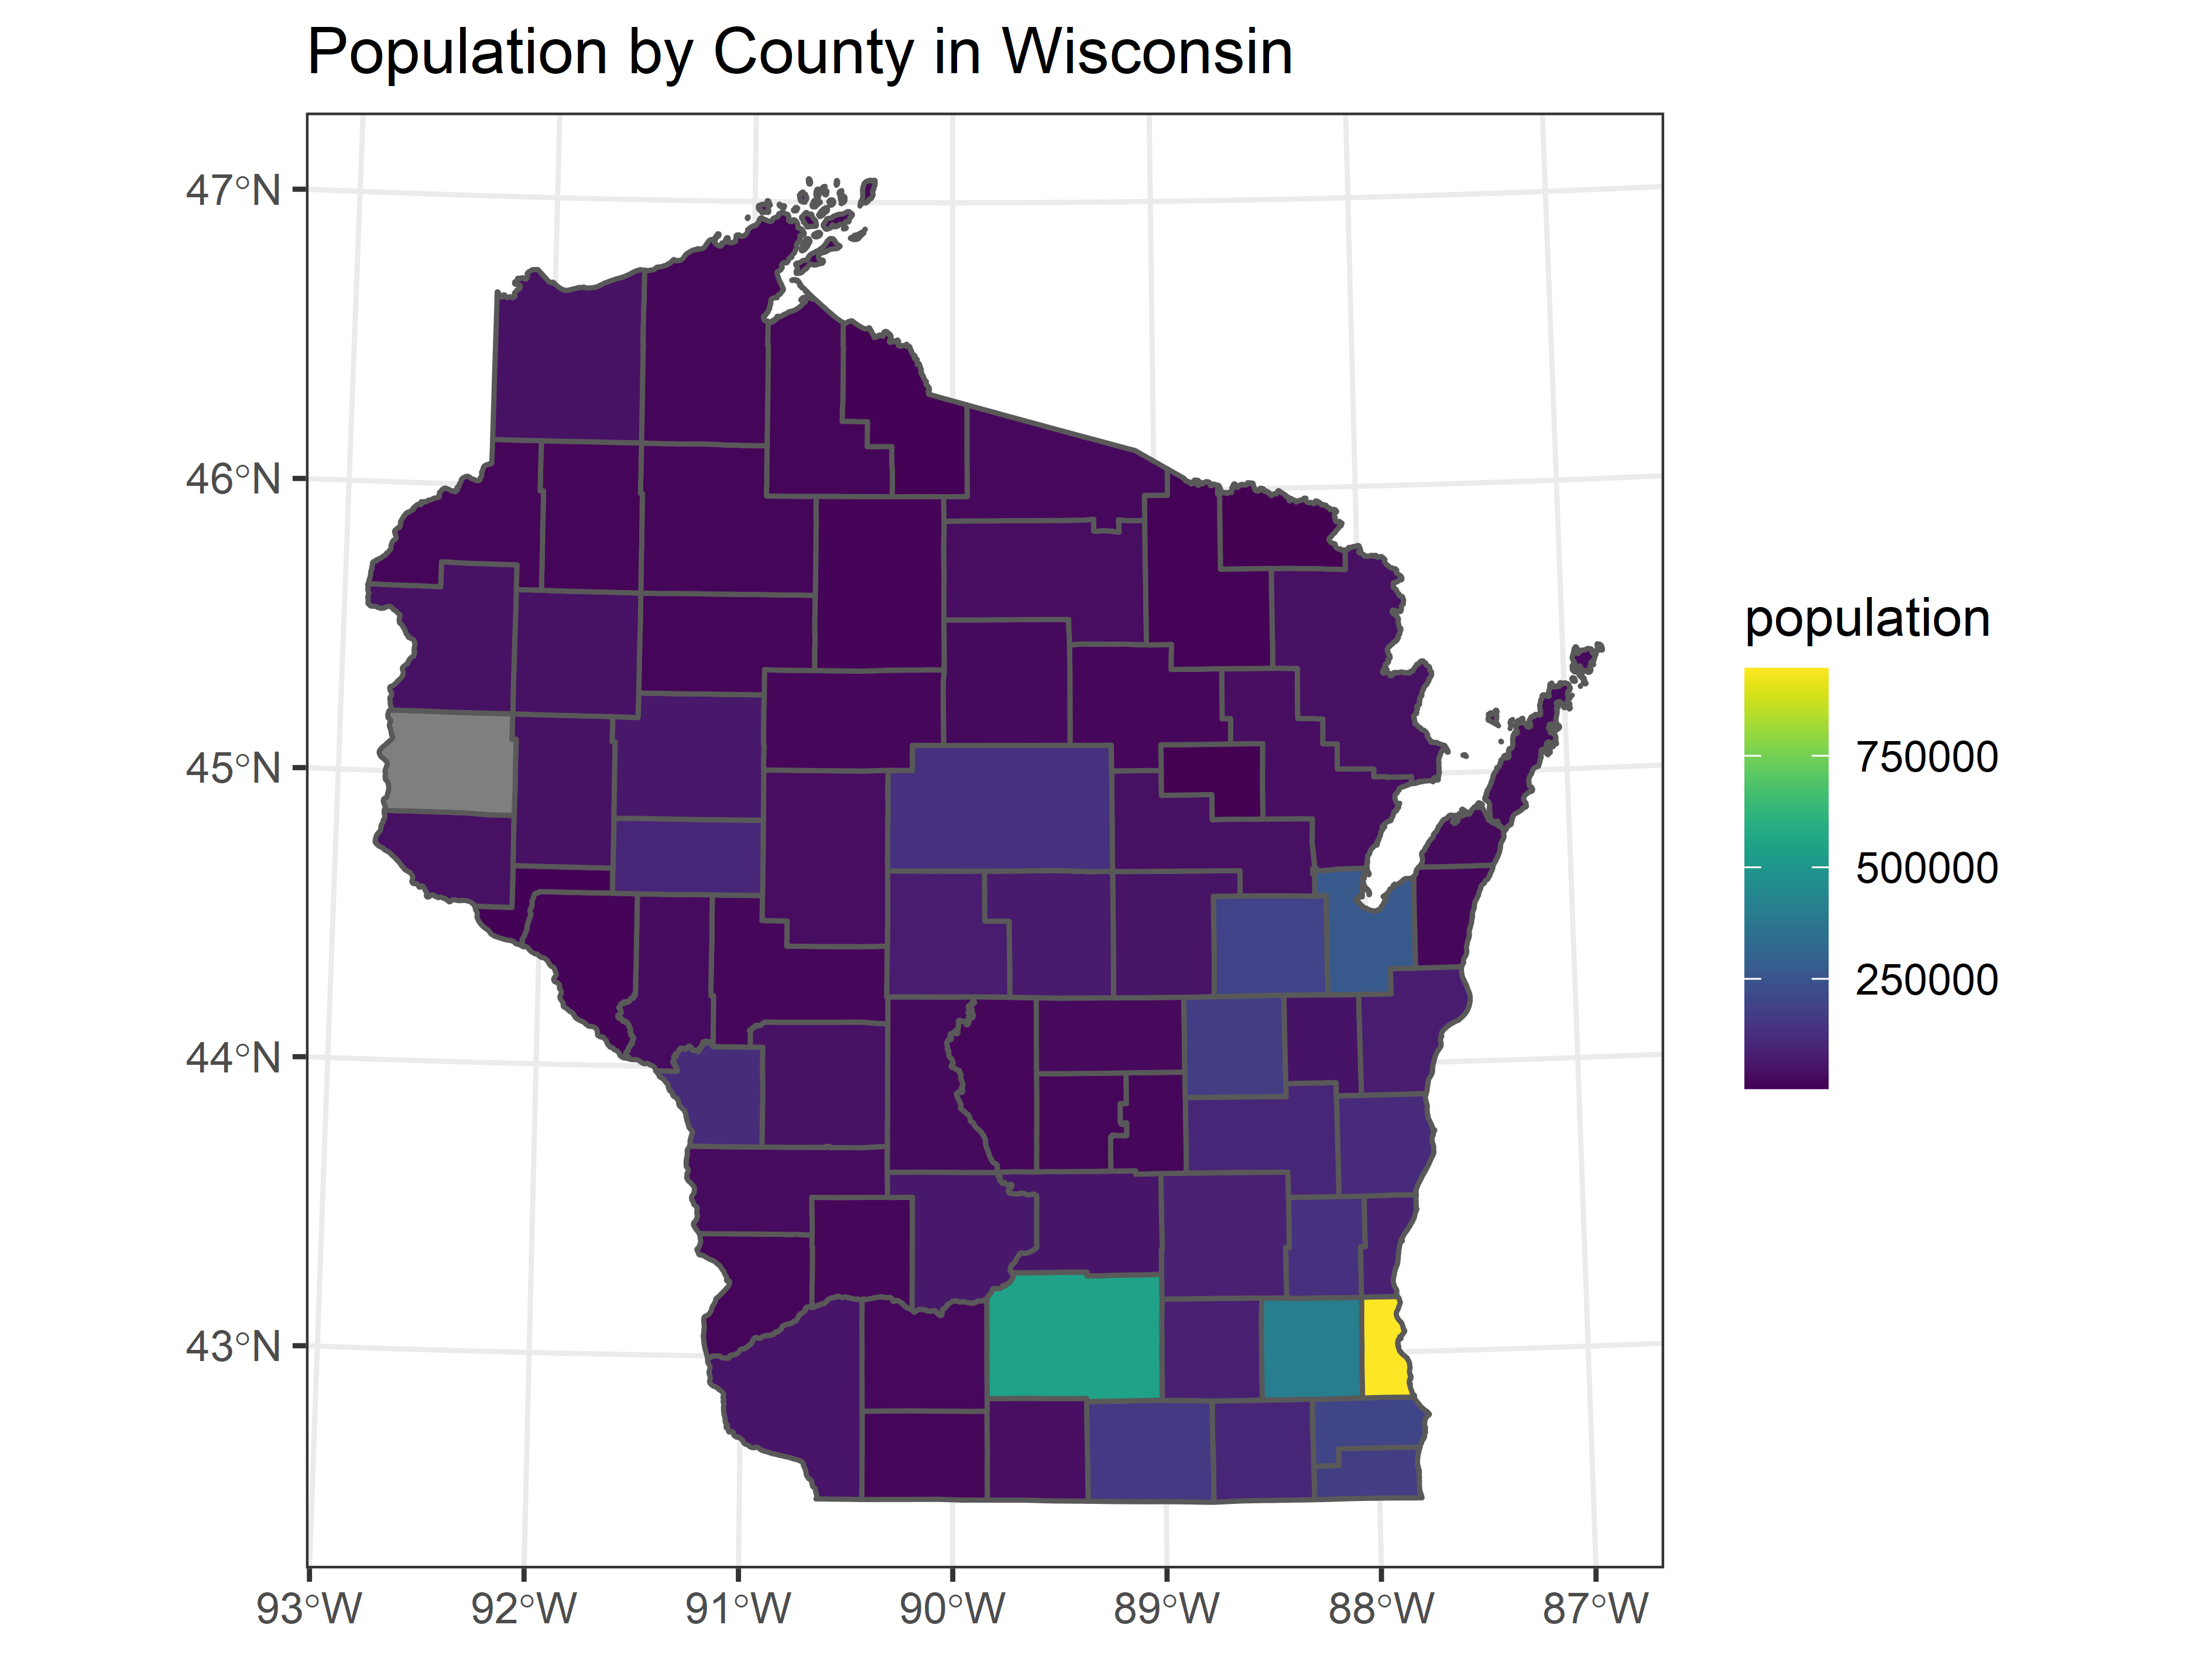
gg_wi = ggplot(Wi_counties_join) +
geom_sf(aes(fill = pop)) +
scale_fill_viridis("population") +
ggtitle("Population by County in Wisconsin") +
theme_bw()
gg_wi
#plot_gg(gg_wi, multicore = TRUE, width = 6 ,height=2.7, fov = 70)
Stack Overflow用户
发布于 2020-07-29 20:16:20
如果您将人口数据转换为数字列并将其加入到您的shapefile中,则应该可以工作。这段代码适用于我:
library(sf)
library(tidyverse)
library(rayshader)
library(viridis)

#Population CSV
population <- read.csv("Wisconsin_Population/co-est2019-annres-55.csv")

#new column COUNTY_NAM matching the county names from shapefile
population$COUNTY_NAM <- substr(as.character(population$V1), 1, nchar(as.character(population$V1))-7)

#convert V2 into numeric column
population$V2 <- as.numeric(population$V2)

#Import Shapefile
Wi_counties <- st_read("Wisconsin_Population/County_Boundaries_24K.shp")

#perform left_join with population data
Wi_counties <- Wi_counties %>% left_join(population, by = c("COUNTY_NAM"))

#Plot Shapefile
ggplot() +
  geom_sf(data = Wi_counties, size = 1, color = "black", fill = "cyan1") +
  ggtitle("WI_Counties") +
  coord_sf()

gg_wi <- ggplot(Wi_counties) +
  geom_sf(aes(fill = V2)) +
  scale_fill_viridis() +
  ggtitle("Population by County in Wisconsin") +
  theme_bw()

plot_gg(gg_wi, multicore = TRUE, width = 6, height=2.7, fov = 70)页面原文内容由Stack Overflow提供。腾讯云小微IT领域专用引擎提供翻译支持
原文链接:
https://stackoverflow.com/questions/63160443
复制相关文章
相似问题
腾讯云开发者

Copyright © 2013 - 2026 Tencent Cloud. All Rights Reserved. 腾讯云 版权所有
深圳市腾讯计算机系统有限公司 ICP备案/许可证号:粤B2-20090059 ![]() 粤公网安备44030502008569号
粤公网安备44030502008569号
腾讯云计算(北京)有限责任公司 京ICP证150476号 | 京ICP备11018762号