
矩阵图中的控制散点图y轴顺序
矩阵图中的控制散点图y轴顺序
提问于 2020-07-06 10:46:11
我试图在matplotlib散点图上控制y轴的顺序,但是我所拥有的数据中x和y轴的顺序导致了图形的不正确显示。
这里有一些代码来说明这个问题,还有一个次优的尝试来解决这个问题。
import pandas as pd
from numpy import random
import matplotlib.pyplot as plt

# make some fake data
axes = ['a', 'b', 'c', 'd']
pairs = pd.DataFrame([(x, y) for x in axes for y in axes], columns=['x', 'y'])
pairs['value'] = random.randint(100, size=16) + 100
# remove the diagonal
pairs_nodiag = pairs[pairs['x'] != pairs['y']]
# zero the values for the diagonal
pairs_diag = pairs.copy()
pairs_diag.loc[pairs_diag['x'] == pairs_diag['y'], 'value'] = 0

fig, ax = plt.subplots(nrows=1, ncols=3, figsize=(5, 3))
scatter = ax[0].scatter(x=pairs['x'], y=pairs['y'], s=pairs['value'])
scatter = ax[1].scatter(x=pairs_nodiag['x'], y=pairs_nodiag['y'], s=pairs_nodiag['value'])
scatter = ax[2].scatter(x=pairs_diag['x'], y=pairs_diag['y'], s=pairs_diag['value'])

plt.show()
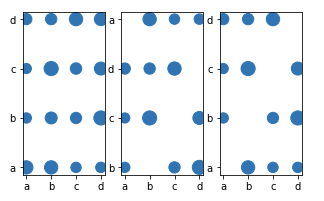
最左边的是原始数据。中间是带问题的图,我希望y轴和最左边的图一样。最正确的情节是我在使用一个次优的解决方案之后。我确信有一种控制轴上顺序的方法,但我在Python方面还不够精通,还不知道如何做到这一点。
回答 1
Stack Overflow用户
回答已采纳
发布于 2020-07-06 14:57:58
您需要使用所需的映射创建自己的StringCategoryConverter (matplotlib默认将字符串映射到发生的序列中的数字)。
import matplotlib.category as mcat

# insert the following before scatter = ax[1].scatter(...
units = mcat.UnitData(sorted(pairs_nodiag.y.unique()))
ax[1].yaxis.set_units(units)
ax[1].yaxis.set_major_locator(mcat.StrCategoryLocator(units._mapping))
ax[1].yaxis.set_major_formatter(mcat.StrCategoryFormatter(units._mapping))
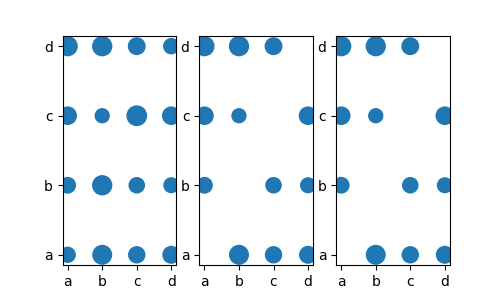
更新:以下是不使用_mapping的官方方法
import matplotlib

# insert the following before scatter = ax[1].scatter(...
scc = matplotlib.category.StrCategoryConverter()
units = scc.default_units(sorted(pairs_nodiag.y.unique()), ax[1].yaxis)
axisinfo = scc.axisinfo(units, ax[1].yaxis)
ax[1].yaxis.set_major_locator(axisinfo.majloc)
ax[1].yaxis.set_major_formatter(axisinfo.majfmt)页面原文内容由Stack Overflow提供。腾讯云小微IT领域专用引擎提供翻译支持
原文链接:
https://stackoverflow.com/questions/62754421
复制相关文章
相似问题
腾讯云开发者

Copyright © 2013 - 2026 Tencent Cloud. All Rights Reserved. 腾讯云 版权所有
深圳市腾讯计算机系统有限公司 ICP备案/许可证号:粤B2-20090059  粤公网安备44030502008569号
腾讯云计算(北京)有限责任公司 京ICP证150476号 | 京ICP备11018762号