
使用Python -在Simbad中进行坐标查询之后,如何提取由Aladin生成的图像(在网站上使用Simbad绘图按钮打开)?
基本目标:给定一组天空坐标(ra,dec),这个Python函数应该返回以这些坐标为中心的天空图像。
详细目标:该函数将使用天文查询和simbad执行坐标查询。理想情况下,它将能够访问以(ra,dec)为中心的给定区域内的对象数据库。因此,还将输入一些大小参数(FoV,或radius)。但是,当通过浏览器对simbad进行查询时,有一个选项可以绘制由AladinLite生成的以输入坐标为中心的星区,并且函数应该返回这个图像(希望是一个适合的图像)。
我尝试过的是:我在这里所做的一切都发现了天体查询和simbad的使用。但是,我在文档中找不到任何关于如何通过天文查询获取来自AladinLite的图像的任何信息。使用Python直接从Aladin获取图像的方法似乎也是不可能的。
问:是否可以使用AladinLite和天文查询在simbad坐标查询的浏览器版本上获取该图像?如果是这样的话,我该怎么做呢?
我附上了一个显示AladinLite生成的图像的web浏览器屏幕截图。为了清楚起见,我想要的是星场的图像,而不是有圆圈物体的图像,等等。
一些伪码:
def generate_starfield(ra, dec, FoV):

    # define the sky coords
    coords = SkyCoord(ra=ra, dec=dec)

    # do an astroquery.simbad query using above coords
    query = perform_query(coords)

    # extract the image from the query generated by AladinLite
    image = get_aladinlite_image(query, FoV)

return image回答 1
Stack Overflow用户
发布于 2020-06-12 14:18:52
警告:我不是天文研究人员,虽然我是Astropy开发人员,但我并不是一个真正的用户,所以如果有更多的经验/了解这个问题的人想要加入,那么可能有一些稍微好一些的方法来做这件事。
但AladinLite并不是一个图像目录。这只是一个基于网络的用户界面,用于图像查看和绘图。然而,U斯特拉斯堡托管的AladinLite示例服务从他们的HiPS调查服务中获取数据。他们通过基于hips2fits网络的API提供这些数据。我认为AladinLite没有提供一个接口来将所有显示的瓷砖收集到一个适合下载的图像中。这就是hips2fits服务的目的。顺便说一句,它在网站上注意到:
我们将开发一个从hips2fits访问astroquery.cds的方法。同时,这个笔记本应该让您开始从hips2fits脚本中查询hips2fits。
因此,您可以使用工作流的第一部分:使用astroquery查询Simbad。但是,您需要查询图像数据。目前还没有特定于Python的API,但是web已经有了很好的文档,所以它主要是构建正确的URL。下面是我想出的使用屏幕截图中的相同坐标的工作流示例:
>>> from astroquery.simbad import Simbad
>>> from astropy.coordinates import SkyCoord
>>> coord = SkyCoord('16 14 20.30000000 -19 06 48.1000000', unit=(u.hourangle, u.deg), frame='fk5')
>>> query_results = Simbad.query_region(coord)
>>> query_results
<Table length=3>
        MAIN_ID               RA           DEC      ... COO_QUAL COO_WAVELENGTH     COO_BIBCODE
                           "h:m:s"       "d:m:s"    ...
         object             str13         str13     ...   str1        str1             object
----------------------- ------------- ------------- ... -------- -------------- -------------------
               [T64]  7 16 14 20.2881 -19 06 48.062 ...        A              O 2018yCat.1345....0G
        IRAS 16114-1858    16 14 22.1     -19 06 14 ...        E              M 1988IRASP.C......0J
2MASS J16142091-1906051 16 14 20.9018 -19 06 05.195 ...        A              O 2018A&A...616A...1G
现在假设我想要一个以结果中的第一个对象为中心的图像(类似于web上显示的AladinLite预览):
>>> from urllib.parse import urlencode
>>> from astropy.io import fits
>>> object_main_id = query_results[0]['MAIN_ID'].decode('ascii')
>>> object_coords = SkyCoord(ra=query_results['RA'], dec=query_results['DEC'],
...                          unit=(u.hourangle, u.deg), frame='icrs')
>>> query_params = {
...     'hips': 'DSS',
...     'object': object_main_id,
...     'ra': object_coords[0].ra.value,
...     'dec': object_coords[0].dec.value,
...     'fov': (2 * u.arcmin).to(u.deg).value,
...     'width': 500,
...     'height': 500
... }
>>> url = f'http://alasky.u-strasbg.fr/hips-image-services/hips2fits?{urlencode(query_params)}'
>>> hdul = fits.open(url)
Downloading http://alasky.u-strasbg.fr/hips-image-services/hips2fits?hips=DSS&object=%5BT64%5D++7&ra=243.58457533549102&dec=-19.113364937196987&fov=0.03333333333333333&width=500&height=500
|==============================================================| 504k/504k (100.00%)         0s
>>> hdul.info()
>>> hdul.info()
Filename: /path/to/.astropy/cache/download/py3/ef660443b43c65e573ab96af03510e19
No.    Name      Ver    Type      Cards   Dimensions   Format
  0  PRIMARY       1 PrimaryHDU      22   (500, 500)   int16
>>> hdul[0].header
SIMPLE  =                    T / conforms to FITS standard
BITPIX  =                   16 / array data type
NAXIS   =                    2 / number of array dimensions
NAXIS1  =                  500
NAXIS2  =                  500
WCSAXES =                    2 / Number of coordinate axes
CRPIX1  =                250.0 / Pixel coordinate of reference point
CRPIX2  =                250.0 / Pixel coordinate of reference point
CDELT1  = -6.6666668547014E-05 / [deg] Coordinate increment at reference point
CDELT2  =  6.6666668547014E-05 / [deg] Coordinate increment at reference point
CUNIT1  = 'deg'                / Units of coordinate increment and value
CUNIT2  = 'deg'                / Units of coordinate increment and value
CTYPE1  = 'RA---TAN'           / Right ascension, gnomonic projection
CTYPE2  = 'DEC--TAN'           / Declination, gnomonic projection
CRVAL1  =           243.584534 / [deg] Coordinate value at reference point
CRVAL2  =         -19.11335065 / [deg] Coordinate value at reference point
LONPOLE =                180.0 / [deg] Native longitude of celestial pole
LATPOLE =         -19.11335065 / [deg] Native latitude of celestial pole
RADESYS = 'ICRS'               / Equatorial coordinate system
HISTORY Generated by CDS hips2fits service - See http://alasky.u-strasbg.fr/hips
HISTORY -image-services/hips2fits for details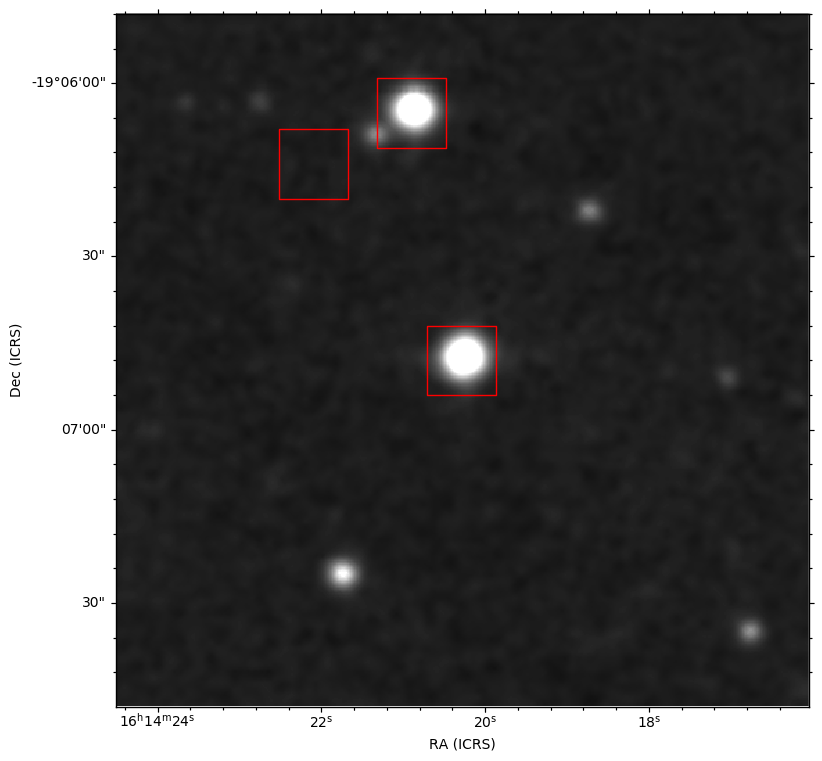
HISTORY From HiPS CDS/P/DSS2/NIR (DSS2 NIR (XI+IS))现在是密谋。在AladinLite预览中看到的各种标记和滴答都是由AladinLite查看器本身生成的,因此使用基于Python的工作流,您现在可以自己绘图了。解决这个问题有很多种方法。您现在可以保存FITS图像,并使用任何您已经可用的绘图工具。尽管对于纯Python工作流,波澜不惊包是专门为天文图设计的。下面是我对这张图片的处理方法,举个例子:
>>> import aplpy
>>> gc = aplpy.FITSFigure(hdul)
>>> gc.show_grayscale()
INFO: Auto-setting vmin to  2.560e+03 [aplpy.core]
INFO: Auto-setting vmax to  1.513e+04 [aplpy.core]
>>> gc.show_markers(object_coords.ra, object_coords.dec, edgecolor='red',
...                 marker='s', s=50**2)
>>> gc.save('plot.png')
结果:
https://stackoverflow.com/questions/62318910
复制相似问题
腾讯云开发者

Copyright © 2013 - 2026 Tencent Cloud. All Rights Reserved. 腾讯云 版权所有
深圳市腾讯计算机系统有限公司 ICP备案/许可证号:粤B2-20090059 ![]() 粤公网安备44030502008569号
粤公网安备44030502008569号
腾讯云计算(北京)有限责任公司 京ICP证150476号 | 京ICP备11018762号